


Banking Future: Day of the Tortoise?
Is conservative lending community bank "secret" for success?
- |
- Written by By R. Alton Gilbert, Andrew P. Meyer, and James W. Fuchs,

Editor's Introduction: A research team at the Federal Reserve Bank of St. Louis recently published a very interesting and instructive paper that seeks to answer the question of how community banks can make it, going forward. This excerpt from the team's study, "The Future of Community Banks: Lessons from Banks That Thrived During the Recent Financial Crisis," gives the gist:
"The thesis of our article is that the community banks that will succeed in the future will likely have characteristics similar to those of the community banks that performed well during the recent financial crisis and its aftermath. The events of recent years can be considered a real-world stress test of the community bank business model."
The full report is quite long. It can be read with all supporting graphics, footnotes, research credits, and acknowledgements in the Federal Reserve Bank of St. Louis Review. The following condensed excerpts provide a general understanding and flavor of the team's findings. We found both the initial numerical analysis and the interviews with "thriving" bankers summarized after that, quite interesting.
Please note that not all graphics have been used; to ensure continuity with the authors' full study, the graphics number has been retained. Example: What you see below begins with Table 2, to match the numbering in the full work.
After you read this condensation of the study, read blogger Ed O'Leary's take on the findings in his "Conservative Banks Outperform The High-Fliers."
* * *
Community banks play a vital role in the U.S. economy by allocating credit and providing financial services in their communities--particularly to the small businesses in those communities. Over the past 30 years, however, the number of charters for all types of banks has declined. For example, the number of commercial bank charters has shrunk by more than 50% since 1985. (The number of commercial bank branches has also declined, but by a lower percentage.) The recent financial crisis contributed to this decrease in the number of community bank charters--in part through mergers and in part through bank failures. In fact, 417 banks and thrifts failed from the beginning of 2006 through the end of 2011. Although the pace of bank failures in 2012 was slower than in recent years, an additional 51 banks failed in that year. These events raise questions about the future role of banks in the economy.
Given these changes in the banking landscape, one could focus on the decline in the number of charters, the reasons for recent bank failures, and in general the many reasons certain community banks may not survive over different time horizons. This study takes a different approach:
We investigate what can be learned from the operation of banks that maintained strong performance in recent years, even in the wake of the financial crisis.
The thesis of our article is that the community banks that will succeed in the future will likely have characteristics similar to those of the community banks that performed well during the recent financial crisis and its aftermath. The events of recent years can be considered a real-world stress test of the community bank business model. We report on work in progress on interpreting the results of that stress test.
The next section describes our criteria for identifying the banks that performed well during the financial crisis and its aftermath, which we define as "thriving banks." First, we examine various characteristics of the thriving banks: the number that met the criteria for classification as thriving, their asset size, and their location by state. We investigate whether community banks in states with the greatest declines in economic activity in recent years could operate as thriving banks. We then compare the characteristics of the thriving banks with other community banks, which we define as "surviving banks." The surviving banks did not fail in recent years but also did not meet the criteria for thriving banks.
We use insights gained from the comparisons of the thriving and surviving banks to guide the second phase of our analysis. We selected a sample of thriving community banks and asked their leaders how their banks were able to maintain strong performance through the financial crisis and subsequent weak economic recovery.
The interviews with leaders of these thriving banks indicate that they had maintained a strong commitment to conservative lending principles while competitors had relaxed their lending standards. Beyond this common commitment to conservative lending principles, the striking feature of the thriving banks we investigated is their diversity: Each appears to have found a business plan that works in its market area, but its business plan is very different from those of some of the other thriving banks we interviewed.
The diversity among the thriving banks is the basis for the third phase of our analysis, in which we examine various facets of that diversity. We then present our conclusions.
Thriving versus surviving community banks
We restrict the asset size of the community banks in our study to those with total assets less than $10 billion. This restriction is based on a definition of community banking organizations in the Dodd-Frank Wall Street Reform and Consumer Protection Act of 2010. We also exclude from our sample banks that were subsidiaries of foreign institutions at any time from 2006 through 2011. In addition, we eliminate thrifts, bankers' banks, industrial loan corporations, and cooperative banks. We eliminate banks chartered after 2001 because performance measures of de novo banks are often substantially different during their first 5 years from those of banks in operation for longer than 5 years.
Our criterion for strong performance is maintaining the highest supervisory rating, a composite CAMELS rating of 1, during the years 2006 through the end of 2011; we refer to this condition as "thriving." We choose supervisory ratings rather than specific financial ratios as indicators of a bank's health because the composite CAMELS rating captures a bank's overall financial condition plus an assessment of its management. We find that if we had looked at only performance measures such as return on assets or return on equity, we would have excluded many banks that did, in fact, thrive: Many banks with the highest supervisory rating endured the turbulence of recent years by implementing business plans that were successful but that did not yield relatively high measures of profitability.
As noted earlier, all other institutions that did not fail that fall outside these parameters are classified as "surviving banks" for the purposes of our analysis. We acknowledge, however, that many banks that did not meet our criterion for thriving banks are in sound financial condition.
We limit the banks identified as thriving banks to those with CAMELS ratings of 1 for two reasons. First, because our goal is to identify all community banks in the nation that meet our standard for thriving banks, we want to limit the number of banks in our sample. Second, some banks with a CAMELS rating of 2 (generally considered to be safe and sound) could be approaching a downgrade to a CAMELS rating of 3. We want to exclude from the category of thriving any banks that may have been on this margin of being downgraded to a CAMELS rating of 3.
To better understand the differences between thriving and surviving banks, we answer the following questions:
• How many banks met the criteria for thriving community banks, and were they concentrated in a particular asset size range?
• Were the thriving banks concentrated in states with relatively strong economic growth?
• How did the performance of thriving banks compare with the performance of surviving banks?
• Were thriving banks serving the consumers in their respective communities any better or worse than the surviving banks?
• How did the growth of thriving banks compare with that of surviving banks before and during the crisis?
• What balance sheet attributes distinguish thriving banks from surviving banks?
In all, 702 banks met our conditions for classification as thriving banks. The thriving banks are not concentrated in any asset size range. Many had total assets below $50 million as of December 2011, but 36 of the thriving banks had total assets between $1 billion and $10 billion. These observations indicate that the secret to operating a thriving community bank does not necessarily involve keeping total assets within a certain size range.
The thriving banks were located in 40 of the 50 states. Of the 702 thriving banks, 124 were located in Texas. The nine states with the largest number of thriving banks account for 73% of all the thriving banks. This geographic concentration appears to be related to the relative prosperity of the agricultural and energy sectors of the economy, at least through 2011.
The geographic distribution of the thriving banks, however, indicates that some community banks were able to maintain high levels of performance while operating in adverse economic environments. Table 2 ranks the states by their percentage of thriving banks.
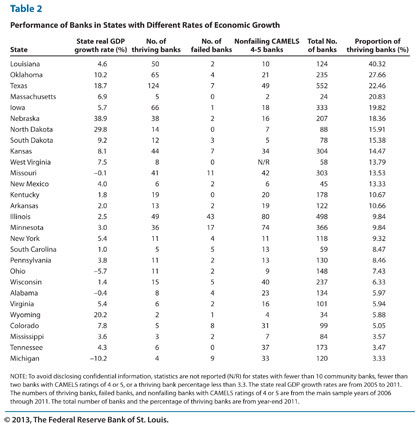
For a larger version of this table, click here.
It also shows the growth of states' real gross domestic product (GDP) and the number of failed banks and banks with CAMELS ratings of 4 or 5 over the sample period. Some of the thriving banks were located in states with the sharpest rates of decline in real GDP between 2005 and 2011. For instance, real GDP in Michigan declined 10.2% between 2005 and 2011. The economic distress in Michigan had adverse effects on that state's banks: Nine banks failed during the 2006-11 period, and 33 banks had CAMELS ratings of 4 or 5 during these years but did not fail. And yet, four Michigan banks maintained CAMELS ratings of 1 during these years. The pattern was similar in Ohio, where real GDP declined 5.7% between 2005 and 2011: Two Ohio banks failed during the 2006-11 period, and nine Ohio banks had CAMELS ratings of 4 or 5 during these years but did not fail. And yet, eleven Ohio community banks maintained CAMELS ratings of 1 during these years.
Other banks, in contrast, performed poorly in more favorable economic environments. For instance, in Texas, where state real GDP increased 18.7% between 2005 and 2011, seven banks failed during the 2006-11 period, and 49 banks had CAMELS ratings of 4 or 5 but did not fail.
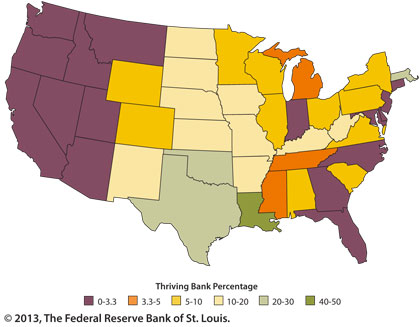
For a larger version of this map, click here.
As shown in Figure 2, the regions with the fewest thriving banks are on the West Coast and in the Southeast, areas with some of the biggest declines in property values in the nation. In contrast, states with the highest concentrations of thriving banks tend to be located in the agricultural center of the country. The states with the most successful thriving banks--Louisiana (40.32%), Oklahoma (27.66%), and Texas (22.46%)--combine a healthy agricultural sector with a strong energy sector.
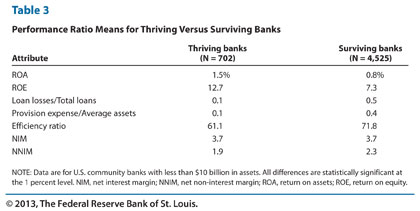
For a larger version of this table, click here.
Table 3 indicates that the thriving banks indeed outperformed the surviving banks on a wide variety of performance measures. For example, throughout the sample period (2006-11), the mean return on assets for thriving banks was 1.5%, compared with only 0.8% for surviving banks. Thriving banks also managed a higher return on equity to their shareholders (12.7% versus 7.3%). And, as the table shows, the mean for thriving banks in the sample was better than the corresponding mean for surviving banks for every other performance measure in the table. We conclude from the data in this table that these banks are thriving in more ways than maintaining high safety-and-soundness ratings.
One question that arises is whether certain banks were able to thrive by putting more emphasis on profits than the needs of their customers.
For example, a bank might limit lending in low-income neighborhoods in its market area, choose not to offer products appropriate to its low-income customers, engage in deceptive advertising or incomplete disclosures for its loan products, or discriminate against certain customers on the basis of race, gender, age, or other prohibited factors.
These practices, however, would result in adverse Community Reinvestment Act (CRA) ratings and consumer compliance ratings. For each bank, we identified the worst rating for both types of consumer examinations during the sample period of 2006 through 2011. We found that only 0.73% of thriving banks had less-than-satisfactory CRA ratings compared with 1.68% for surviving banks. For consumer compliance examination ratings, the corresponding numbers were 4.29% versus 15.87%. Thus, we find no evidence that the thriving banks were any worse than the surviving banks in the treatment of potential customers in their communities.
Another difference between the thriving and the surviving banks: In the period leading up to the crisis (the beginning of 2004 to the end of 2007), asset growth in the surviving banks was considerably higher than in the thriving banks (44.28% versus 23.58%).
Once the crisis hit, however, surviving bank growth plummeted to 26.91% while thriving bank growth actually increased to 31.16%. For total loans, the pre-crisis difference was even more stark (66.04% for surviving banks versus 31.06% for thriving banks). Once the crisis hit, loan growth for the surviving banks fell dramatically to 18.67% while loan growth for the thriving banks fell moderately to 19.68%.
This pattern is consistent with our interview evidence (presented later in this article) that the thriving banks exercised a comparatively conservative growth strategy during good times and were able to capitalize on the mistakes of their competitors during bad times.
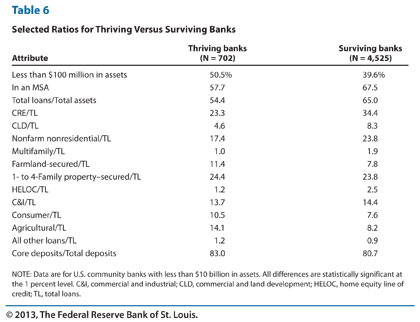
For a larger version of this table, click here.
Table 6 presents averages of several attributes for thriving banks and surviving banks over the 24 quarters from 2006:Q1 through 2011:Q4.2 Compared with the surviving banks, the thriving banks were
• smaller (a higher percentage had total assets less than $100 million),
• more rural (a smaller percentage were headquartered in metropolitan statistical areas [MSAs]),
• less "loaned up" (i.e., had lower total loans-to-total assets ratios),
• less concentrated in commercial real estate (CRE),
• much less concentrated in construction and land development loans,
• slightly more concentrated in 1- to 4-family property mortgages held in their portfolio,
• slightly less concentrated in commercial and industrial loans,
• more concentrated in consumer loans,
• more concentrated in agricultural loans, and
• more reliant on core deposits.
One reason the thriving banks were less likely than the surviving banks to be headquartered in an MSA is the good performance of agricultural loans during our sample period. There is no guarantee that the good performance of agricultural loans will continue in the future.
Of course, a large part of good performance stems from measures of management quality and the local economic condition of the communities in which banks provide their services, both of which are difficult to quantify.
To provide insight into these complex measures among banks, we studied examination reports for a sample of thriving banks and found several recurring themes. In general, thriving banks:
• had a strong and localized customer service focus with high community visibility,
• operated in a thriving (i.e., growing) community,
• practiced forward-looking risk management with an eye toward long-term bank performance,
• demonstrated balance between growth objectives and risk level, and
• had patient and conservative ownership operating with the belief that returns on investment should be attractive but not necessarily spectacular.
Comments in examination reports indicate that thriving banks benefit from strong communities and community relationships, conservative underwriting, and good product structure.
Insights from interviews with leaders of thriving banks
In the second phase of our study, we asked senior bank management about the reasons for their bank's success. [Editor's note: The study also compared findings with other research, at length. This can be read in the full version of the study, in the link given earlier.]
A common theme among several respondents was that their bank's good performance was due more to actions taken before the recent financial crisis than to any actions taken during the crisis.
For example, the thriving banks did not vary from the policies and procedures established years earlier, even as other banks were seeking higher returns based on inflated asset values. Some bankers were quite candid in attributing part of their success to being in the right place at the right time. In some cases, banks benefited from booming farmland, commodity, or energy prices. Most bankers insisted, however, that in their underwriting they did not assume that high land and commodity prices would last forever.
The following summarizes the common themes among thriving community banks:
Conservative Lending Principles. All bankers emphasized conservative lending principles as a key to their success. A common theme in the interviews was that thriving banks were doing the things they understood.
Most thriving banks interviewed limited their lending or other activities to their own communities. All bankers emphasized avoiding opportunities for which they did not have expertise. Some bankers mentioned losing business to competitors before the recent financial crisis because competitors were relaxing their lending standards. Several bankers mentioned maintaining minimum down payment percentages for loans while competitors were cutting down payments required of their borrowers.
This emphasis on conservative lending principles is not surprising given that respondents were talking to staff members of a bank supervisory agency. The supervisory ratings of these banks and their general performance during recent years, however, are consistent with an emphasis on conservative lending principles.
Some bankers mentioned the work of their loan committees in maintaining high lending standards. One banker mentioned that the bank does its own underwriting of credit risk rather than relying on credit scores in making lending decisions. Another banker said that the bank identifies loans that are past due for five days or more and acts quickly to deal with problems of delinquent loans. The conservative lending principles for this bank include dealing with problems quickly.
Most bankers interviewed also discussed the importance of learning from loans they ultimately had to charge off. One bank in particular required its lenders to review all charged-off loans, reassess the fundamentals of the loan at the time it was made, and communicate with management whether they would still make that loan today based on those fundamentals.
Not surprisingly, these conservative principles led to low levels of nonperforming loans and loan losses relative to peer levels. Despite this good performance, many of these thriving banks maintained a high allowance for loan and lease losses (ALLL), in some cases several times the amount of their nonperforming assets. Several bankers mentioned they maintained the bank's ALLL at the highest defensible level to provide maximum cushion for unanticipated loan losses.
Importance of Management and Staff. In the interviews, the leaders of the thriving banks often emphasized their management teams. Some bankers focus on attracting staff from the geographic areas they serve, so their staff will know the communities they serve and will be known by the bank's customers. Some of the thriving banks have been managed by members of the same family for several generations and benefit from this depth of experience and stability in senior management. As well, this family-based structure may include a strong incentive to limit risk so the bank can be passed on to the next generation.
Another common theme among leaders of thriving banks was the importance of the "soft skills" of their staff.
Several bankers went so far as to suggest that they would hire someone with great interpersonal skills over someone with a strong banking background and poor interpersonal skills. Many bankers also mentioned an attempt to gauge the character of job candidates and identified potential employees based on their experiences and interactions with them while they were working in other industry sectors in their communities.
Most leaders of thriving banks mentioned the importance of all staff members staying active in their communities. They discussed how the relationships built by their employees' community service efforts outside the bank increase bank business by creating relationships based on trust and serving community needs.
One banker said his bank does not offer some services because of concern about how those services could affect their reputation in the community. Specifically, the bank does not offer (i) home equity loans because such loans may cause financial trouble for some customers who use this option and (ii) overdraft protection for transactions accounts with high fees for nonsufficient funds.
Ownership Structure and Boards of Directors. Most thriving community banks were C corporations, although some were S corporations. A common statement among management at thriving banks was that bank shareholders should be involved in the operation of the bank as staff or as customers and board members. Most thriving institutions were closely held, and respondents believed that the balance between management and the board was crucial.
Many bankers stated their appreciation for board member involvement in helping to increase bank business and holding management accountable.
They also discussed the importance of having board members who know that their task is not to "run the bank."
Ownership of the shares of one bank involves an employee stock ownership plan. In addition, modest expectations by directors and shareholders for return on their shares in the bank are important for ensuring that the incentives of bank staff are skewed in the direction of limiting risk, thereby avoiding actions to reach for yield by moving into areas outside a bank's core expertise.
Business plans of thriving community banks
The telephone interviews helped us understand the business plans that made it possible for individual banks to succeed in their markets. The banks interviewed are substantially different from each other, and these differences extend beyond asset size.
Interviews indicate that community banks can thrive with a wide variety of business plans. For this reason, our analysis of the performance of all of the thriving banks in the nation focuses on their diversity, rather than on a search for a unique formula for operating a successful community bank.
The good news for the community bank model is that many community banks retained the highest supervisory rating during recent years while operating in geographic areas where other community banks became problem banks or failed.
The following text highlights some of these differences.
Operating Expense Ratios. Some of the thriving banks had relatively high ratios of operating expense to total assets, whereas others had relatively low operating expense ratios.
The leader of one bank explained that it had relatively high ratios of operating expense to total assets because the bank emphasizes customer service. In 2011 the operating expense ratio of this bank was in the top 10% among its peer banks, but the ratio of pretax operating income to total assets of this bank was in the top 30% among its peers.
Other banks had relatively high operating expense ratios because they incurred part of their operating expense by generating relatively high non-interest income.
Other banks had relatively low operating expense ratios compared with their peers. Some bankers emphasized limited investment in their facilities, including fewer offices than some competitors in their market areas. Several bankers mentioned a focus on using technology to serve customers and control costs.
Non-Interest Income. The interviews provided information about the sources of non-interest income of some of the thriving banks that we could not have learned from their financial statements. The following list provides examples of sources of non-interest income that substantially boost the earnings of some of the thriving banks interviewed.
• One banker told us that his bank derives substantial non-interest income by offering accounts receivable services to businesses in its geographic area. The non-interest income of this bank in 2011 was about 1% of its average assets, placing it in the top 10% among its peer banks.
• A bank with less than $50 million in total assets as of December 2011 derives substantial non-interest income by originating and selling loans. Non-interest income of this bank in 2011 was over 2% of its average assets, placing it in the top 3% among its peer banks.
• A bank with less than $100 million in total assets earns substantial non-interest income by offering trust services and counting the currency for a local casino. The ratio of non-interest income to total assets for this bank in 2011 was over 1.3% of its average assets, placing it among the top 4% among its peer banks.
• One community bank generates non-interest income in the form of fees earned by providing temporary financing for residential mortgage loans originated by brokers located throughout the nation. This bank earned non-interest income in 2011 that was about 3% of its average assets, placing it in the top 3% among its peer banks.
Table 6 indicates that the thriving banks as a group have higher ratios of core deposits to total deposits than the surviving banks. Banks tend to pay lower interest rates on core deposits than other types of deposits. Several, but not all, of the thriving banks had relatively low ratios of interest expense to total assets.
One banker said that the interest expense of his bank reflected the local population of senior citizens, who carefully monitor certificate of deposit rate alternatives. This bank offers relatively high interest rates on certificates of deposit to retain these customers' business. In contrast, the banks with relatively low interest expense ratios tend to have deposit liabilities concentrated in demand deposits and money market accounts.
Some of the thriving banks had relatively high concentrations of their assets in CRE, a category of lending that created serious problems at other banks. These thriving banks maintained good performance through strong risk controls and thus avoided the serious problems associated with CRE lending risk that plagued other banks with weaker controls.
One leader of such a bank said that they pursue "structured and disciplined credit policies" in their lending decisions. The "trick" to CRE lending at one of the thriving banks was summarized as follows: CRE lending should be limited to local (i.e., in-market), owner-occupied properties. Table 6 indicates, however, that the thriving banks as a group had lower exposure to CRE loans than the surviving banks.
Capital ratios varied substantially among the thriving banks. One thriving bank had a Tier 1 leverage ratio of about 25% in 2011. In contrast, another bank had a Tier 1 capital-to-total assets ratio near the bottom of the distribution among its peer banks. This second bank, however, had a supervisory rating of 1 on the capital component of its composite CAMELS rating because it had assumed little risk; about 45% of the bank's assets were invested in Treasury and agency securities.
Evidence of diversity among all thriving banks
While our telephone interviews provide valuable insight into the operations of a small number of the thriving banks, this section presents information based on the performance of all 702 thriving banks in the nation (the third phase of our study). We examined the operating characteristics of these thriving banks relative to their peers in the Uniform Bank Performance Report (UBPR).
For a larger version of this table, click here.
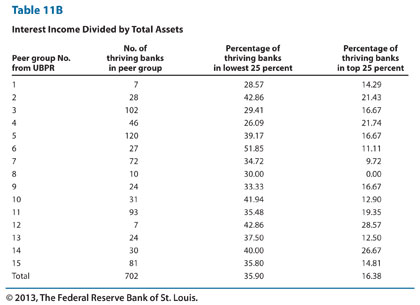
Table 11B indicates that a relatively high ratio of interest income to total assets is not one of the characteristics that distinguish the thriving banks from their peers. About 36% of the thriving banks were in the lowest quarter of the distributions among peers in 2011, whereas only about 16% were in the highest quarter of the distributions.
In all 15 peer groups, the percentage of thriving banks in the lowest 25% of each group is higher than the percentage in the top 25% of each group.
That is, differences in asset size, locations in rural or urban areas, or number of offices do not alter the conclusion. The results in Table 11B are consistent with the finding in Table 6 that, on average, the thriving banks had lower ratios of loans to assets than the surviving banks. Because the interest rates on bank loans tend to be higher than the yields on other bank assets, lower ratios of loans to assets tend to be associated with lower ratios of interest income to total assets.
Many of the thriving banks also have relatively low ratios of interest expense to total assets: Table 11C indicates that 42% of the thriving banks were in the lowest quarter of the distributions. In contrast, 11% of the thriving banks were in the highest quarter of the distributions for this ratio.
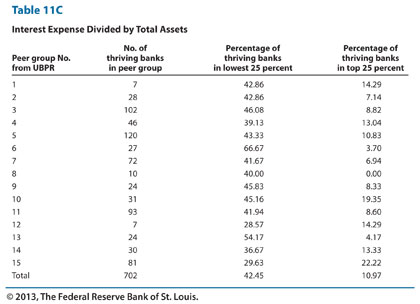
For a larger version of this table, click here.
Our telephone interviews indicated the importance of non-interest income for some thriving banks. Statistical research, however, indicates that overall, the ratios of non-interest income to total assets for thriving banks are similar to those of their peers: 27% in the highest quarter and 19% in the lowest quarter.
The research also illustrates the importance of relatively low operating expense for a majority of the thriving banks: Overall, the ratio of non-interest expense to total assets was in the lowest quarter of the distribution for 46% of thriving banks. And yet, this ratio was in the highest quarter of the distribution for 11% of thriving banks, illustrating the diversity among the thriving banks. In each of the 15 peer groups, however, the percentage of thriving banks with non-interest expense ratios in the lowest 25% among peer banks is higher than the percentage in the top 25%. Overall, relatively low operating expense is a general characteristic of most of the thriving banks across asset size and urban or rural location.
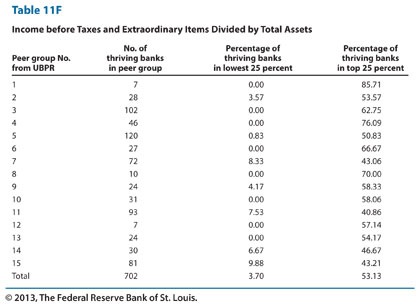
Thriving banks tended to have higher ratios of income before taxes and extraordinary items divided by total assets than their peers. We use pretax income as the measure of profitability because some of the thriving banks are organized as subchapter S corporations (income tax paid by owners, not the banks), whereas others are not.
Table 11F indicates that 53% of the thriving banks had ratios of pretax income to total assets in the highest quarter of the distributions; this measure of profitability was in the lowest quarter for only 4% of the thriving banks. This pattern of high ratios of pretax income to total assets holds for thriving banks in each of the 15 peer groups.
For a larger version of this table, click here.
The thriving banks tended to have higher capital ratios than their peers, but there is substantial diversity among the thriving banks with regard to capital ratios. Research indicates that 39% of thriving banks had Tier 1 leverage ratios in the highest quarter of the distributions, but 18% of the thriving banks had ratios in the lowest quarter of the distributions. The information from the telephone interviews indicates that the thriving banks with relatively low Tier 1 leverage ratios tended to assume relatively low credit risk.
Many of the thriving banks had relatively high concentrations in CRE. Because of concern that the loans of many banks were becoming too concentrated in CRE, the federal bank supervisory agencies issued guidelines in December 2006 for concentrations in this area of lending. Under these guidelines, banks were flagged for special attention if commercial real estate loans exceeded 300% of risk-based capital or construction and land development loans exceeded 100% of risk-based capital.
Of the 702 thriving banks, 16% had concentrations in CRE that exceeded the federal supervisory guidelines at some point during the 2006:Q1-2011:Q4 period. Nevertheless, these banks maintained composite CAMELS ratings of 1 throughout this period. These observations indicate that the thriving banks as a group did not avoid the problems of other banks through relatively low exposures to CRE. Instead, these thriving banks were able to successfully manage the risks inherent in CRE lending.
We focus more closely on 39 of the thriving banks that exceeded one or both of these guidelines by 50% or more in at least one quarter during the 2006:Q1-2011:Q4 period. That is, for these banks CRE loans exceeded 450% of risk-based capital or construction and land development loans exceeded 150% of risk-based capital.
These institutions tended to be among the larger thriving banks; 87% of these banks had assets above $100 million as of December 31, 2011, compared with 58% for all thriving banks. These banks were headquartered in 14 states but concentrated in Texas and Louisiana. Supervisory ratings of these 39 banks on asset quality are relevant for determining whether examiners were critical of the quality of these CRE loans. For 17 of the 39 banks, the component of the CAMELS rating for asset quality was 1 in each examination from 2006 through 2011, and the lowest rating on asset quality was 2 for the other 22 banks. Despite these high concentrations in CRE, the bankers for these 39 thriving banks demonstrated a deep knowledge of these "concentrated" lines of business and had robust risk management controls in place in case their niche business line underperformed.
Conclusion
Our analysis implies there is a role for community banks in our nation's financial system in the future. The community banks that prosper in the future will have characteristics similar to those of the thriving banks interviewed: strong commitments to maintaining standards for risk control in all economic environments and business plans that work for their individual markets.
We recognize, however, that the results of our analysis are shaped by the economic environment of our sample period: 2006 through 2011. The characteristics of banks that meet the criteria for thriving banks would tend to be somewhat different if the analysis covered other years. For example, during our sample period, a concentration in agricultural lending had a statistically significant impact on whether a bank was a thriving bank. Given the increases in land prices and agricultural product prices in recent years, a positive association between agricultural lending and community bank performance is not surprising.
If we were to conduct this study with data from the 1980s, however, we would tend to observe the opposite case: Concentrations in agricultural lending were sources of weakness. Also, given the poor performance of banks with high concentrations of CRE during the recent financial crisis (a source of strength for community banks before 2006), it is important to view our results in the context of the period used for this study.
In addition, a more forward-looking analysis of the future of community banking in the United States would take into account many additional factors, particularly the cost of regulatory compliance under the Basel III international capital accords and under the Dodd-Frank Act when fully implemented. [Emphasis added.]
About the authors
R. Alton Gilber is a visiting scholar and economist emeritus, Andrew P. Meyer is a senior economist, and James W. Fuchs is an assistant vice-president at the Federal Reserve Bank of St. Louis. To read the full version of this study, click here.
[This article was posted on April 5, 2013, on the website of Banking Exchange, www.bankingexchange.com, and is copyright 2013 by the American Bankers Association.]
Tagged under Management, Financial Trends, Community Banking,