


SNL Report: Service charge drain hits small banks hard
SNL Report: Under $500 million set sees heaviest change over a decade
- |
- Written by SNL Financial

By David Hayes and Andrew Wolcott, SNL Financial staff writers
Over the last decade, noninterest income remained relatively range-bound for the nation's commercial banks, ranging in aggregate from 33% to 41% of operating revenue for those institutions with more than $10 billion in assets. For banks with less than $10 billion, the aggregate range was 22% to 25% of operating revenue. However, the significance of service charges on deposits has waned for the industry, with banks of all sizes generally relying less on such service charges than they have in the past.
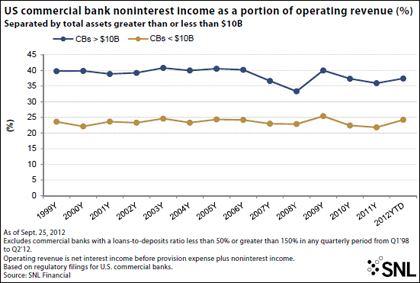
For a larger version of this chart, click here or on the image.
Service charges for commercial banks with more than $10 billion in assets accounted for 6.09% of operating revenue for the first six months of 2012, down significantly from the 10.98% posted for 2008. Those commercial banks with less than $10 billion posted service charges equal to 5.81% of operating revenue for the first six months of 2012.
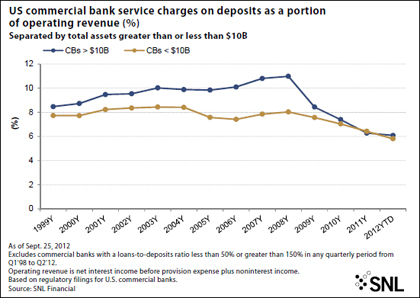
For a larger version of this chart, click here or on the image.
An uneven "return to normalcy"
Service charges were undoubtedly impacted after changes to Regulation E became effective in mid-2010, precluding banks from charging overdraft fees on ATM transactions and one-time debit card transactions if a customer did not "opt in" for the overdraft service.
Yet while service charges may be down significantly from their peaks in 2009, in nominal terms, they are more in line with the amount of service charges earned across the industry 10 years ago.
Indeed, among all commercial banks included in this analysis, service charges on deposits totaled $11.7 billion in the first six months of 2012, $23.5 billion in 2011, and $23.5 billion in 2002. For 2009, service charges totaled $31.0 billion.
However, this return to "normalcy" has not been evenly applied across the banking spectrum.
Service charges actually climbed to $18.9 billion in 2011 for those banks with more than $10 billion in assets, up from $17.7 billion in 2002, while those with less than $10 billion in assets saw total service charges fall to $4.5 billion in 2011 from $5.8 billion in 2002, a decline of 21.13%.
Including only those commercial banks with less than $1 billion in assets, service charges fell to $2.2 billion in 2011 from $3.2 billion in 2002, a decline of 32.85%. Narrowing the scope even more, banks with less than $500 million in assets saw their service charges fall to $1.4 billion from $2.4 billion over the same time period, a decline of 41.15%.
Relatively speaking, service charges are now a smaller slice of the noninterest income pie. Service charges accounted for only 17.29% of noninterest income for banks as a whole for the first six months of 2012, down from 26.41% in 2002. Banks over the $10 billion threshold relied on service charges for 16% of noninterest income for year-to-date 2012, down from 24% at year-end 2002. Banks under $10 billion in assets posted service charges worth 24% of noninterest income for the first six months of 2012, down from 36% in 2002.
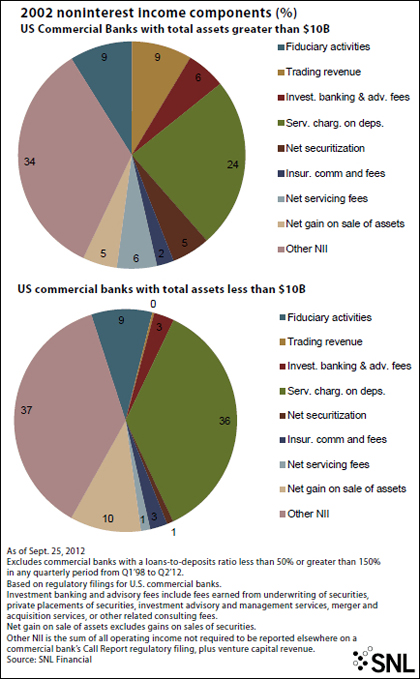
For a larger version of this chart, click here or on the image.
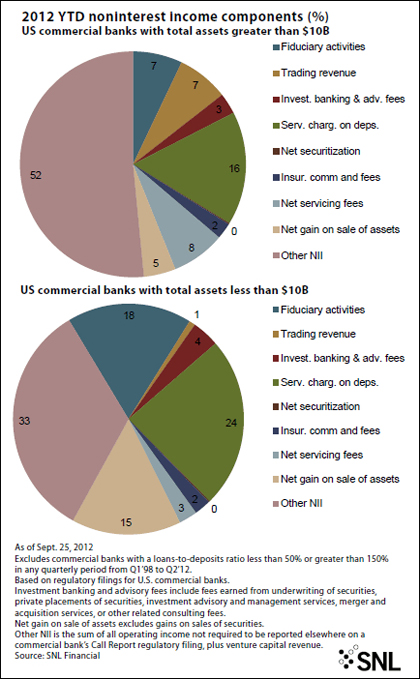
For a larger version of this chart, click here or on the image.
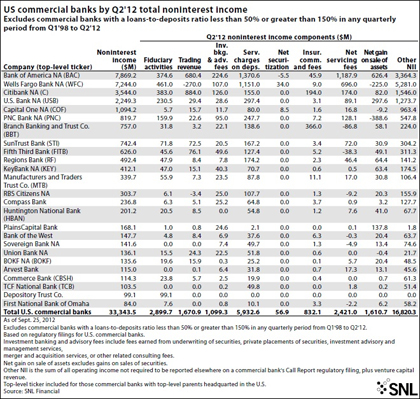
Bank of America, NA, posted the highest amount of service charges among all commercial banks considered in this analysis for the quarter ended June 30, at $1.4 billion. The bank's service charges reached $10.9 billion in 2008 before falling to $8.5 billion in 2009, $6.5 billion in 2010, and $5.4 billion in 2011.
TCF National Bank's $49.8 million in service charges equaled 48.14% of the company's noninterest income, the highest proportion among the 25-largest banks by noninterest income in the chart below. TCF's service charges hit $293.0 million in 2009 then fell to $278.2 million in 2010 and $225.0 million in 2011.
For a larger version of this chart, click here or on the image.
A note from SNL: In an effort to look at those commercial banks engaged in mostly "traditional" banking, SNL included only those banks that maintained a loan-to-deposit ratio of between 50% and 150% for all quarters between the first quarter of 1998 and the second quarter of 2012.
[This article was posted on October 11, 2012, on the website of Banking Exchange, www.bankingexchange.com, and is copyright 2012 by the American Bankers Association.]
Tagged under SNL Financial Report, Management, Financial Trends,

Related items
- How Banks Can Unlock Their Full Potential
- JP Morgan Drops Almost 5% After Disappointing Wall Street
- Banks Compromise NetZero Goals with Livestock Financing
- OakNorth’s Pre-Tax Profits Increase by 23% While Expanding Its Offering to The US
- Unlocking Digital Excellence: Lessons for Banking from eCommerce Titans