


Mortgages made, even when courts slow recoveries
SNL Report: Despite bloated foreclosure pipelines, lending continues in judicial metros
- |
- Written by SNL Financial
 You might think, “If you can’t foreclose, you can’t lend,” but lenders are still making mortgages even where they can’t seize homes. However, the pace is slower in such locales.
By Sam Carr and Zach Fox, SNL Financial analysts
Metro areas in states with judicial foreclosure processes have seen longer, more bloated delinquency pipelines, but loan growth does not appear to have suffered greatly.
Comprehensive mortgage data, as required by the Home Mortgage Disclosure Act, was recently released for 2012. Of the nation's 50 states, 24 employ a judicial foreclosure process, according to LPS Applied Analytics. In total, there were 942 defined metro areas with data, excluding Puerto Rico. Of those 942 metros, 32 areas include multiple states that do not use the same foreclosure process.
Of the remaining 910 metro areas, 522 were in nonjudicial states and 388 were in judicial states. Looking at year-over-year loan growth numbers in these metros, there were only minute differences between judicial and nonjudicial states.
The average year-over-year loan growth among nonjudicial states in 2012 was 36.59%, compared to 33.71% among judicial states. That might seem like a significant difference, but nonjudicial states were more likely to have metro areas with outsized growth, skewing the average upward. The median year-over-year loan growth in 2012 was 33.71% in nonjudicial states and 32.42% in judicial ones.
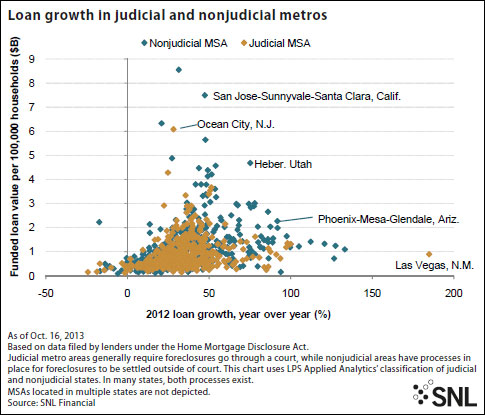 For a larger version, click on the image.
Where foreclosures move, where they don’t
However, there were more noticeable differences at the state level. Average year-over-year growth in nonjudicial states clocked in at 44.29%, significantly outpacing an average of 36.91% in judicial states. Again, the discrepancies were less significant when looking at the median growth, at 39.46% in nonjudicial states and 35.72% in judicial ones.
More than six years since the subprime bubble burst and delinquency rates started to spike in 2007, the difference in foreclosure pipelines between judicial and nonjudicial states has been stark. With the judicial process often putting the lender's ability to foreclose in the hands of a judge, the bloated foreclosure pipelines have taken much longer to clear. In the most recent detailed mortgage report from LPS Applied Analytics, showing data through the end of August, seven of the top 10 states by noncurrent rates were judicial states.
And those trends are likely to become more evident as judicial states face a long road, and the pipeline appears to be growing. In an August report detailing the state of distressed non-agency residential mortgage backed securities as of the second quarter, analysts at Morningstar reported that it would take a full 41 months to clear the nation's distressed inventory at current disposition rates. That figure was worse than the first quarter by one month and three months higher than the prior-year period.
Breaking down the data by judicial and nonjudicial states shows the drastic impact foreclosure processes have on the delinquency pipeline. For judicial states, Morningstar estimated it would take 59 months, as of the first quarter, to clear the foreclosure pipeline, compared to 29 months in nonjudicial states.
But lenders do not appear to be dinging states that make foreclosure more difficult. New Jersey and New York have far and away the longest pipelines, with New York leading all states in the first quarter with 235 months to clear its pipeline.
The latest RealtyTrac report, released Oct. 10, confirmed the trend. The agency reported the average time to foreclose in both states exceeded 1,000 days, compared to the national average of 551 days.
Loan volume grows in Brooklyn
Joshua Stein, a real estate lawyer in New York City, told SNL that the borough of Brooklyn is particularly notorious for delaying foreclosures.
"The reputation out in the market is that the Brooklyn courts will do everything they possibly can to delay and prevent foreclosures," Stein said, later adding: "And if you have a judicial environment that's totally harmful to foreclosures, I don't know why anybody should be doing residential real estate financing in that borough because if you can't foreclose, you can't lend."
But, Stein acknowledged, lenders still do make loans in Brooklyn and securitizations appear to have little problem including loans from Kings County, which constitutes the borough. Indeed, the HMDA data show lenders issued $8.84 billion worth of loans in the county in 2012, up 21.88% from the previous year.
The leading lenders by market share in New York and New Jersey were familiar names. In New Jersey, mortgage originator titan Wells Fargo & Co. topped the state's 2012 market share list, followed by JPMorgan Chase & Co. and Quicken Loans Inc. In New York, Wells Fargo, JPMorgan, and Citigroup Inc. were the top three lenders, in order. They were also the top three lenders for Kings County in 2012.
Tagged under Management, Financial Trends, Mortgage Credit, Technology,

Related items
- How Banks Can Unlock Their Full Potential
- JP Morgan Drops Almost 5% After Disappointing Wall Street
- Banks Compromise NetZero Goals with Livestock Financing
- OakNorth’s Pre-Tax Profits Increase by 23% While Expanding Its Offering to The US
- Banking Exchange Interview: Soups Ranjan Founder and CEO of Sardine Discusses AI