Why deposit strategy must be a top priority
As liquidity stresses rise, funding costs won't be far behind
- |
- Written by ALCO Beat
 ALCO Beat articles featured exclusively on bankingexchange.com are written by the asset-liability management experts at Darling Consulting Group.
By Darnell Canada, managing director, Darling Consulting Group
It’s time to accept the reality that deposit costs are likely to increase. The questions at hand are:
• How quickly will this increase play out?
• How will net interest margin performance be impacted?
Prelude to general rate hikes
While most bankers have not yet increased pricing on their "rack" rates, a growing number have begun to offer CD specials and/or "exception" pricing on a selective basis.
During 2016, weighted average costs remained intact. This was because, with short-term money rates (e.g. Fed funds or 1-month LIBOR) only slightly higher than 0% on average during the year, few depositors found a material benefit to arguing pricing with their branch manager or taking the time to move their liquid funds to other alternatives.
Yields on some money market mutual funds, for example, have remained negative when viewed net of management fees. However, competitive rate incentives are slowly increasing and, therefore, creating greater risk to both bank and credit union margins.
Even if the competitive pricing landscape doesn't yet present a meaningful challenge for your particular institution, the media's influence on public opinion could begin to trigger added pricing pressures. More and more financial media outlets are producing stories that highlight to consumers the higher rates they can expect to pay for borrowing—but without any material benefit received on their deposit funds.
The negative tone in these articles is becoming noticeably stronger. Depositors are likely to soon grow impatient and feel increasingly unhappy.
For banks and credit unions that experience strong loan growth, a compelling argument can be made to absorb the higher marginal cost of deposit retention and growth with the overriding goal of pushing income levels higher. However, the marginal cost of migrating balances can quickly nullify the spread benefits associated with loan growth.
The ability to withstand these related margin pressures will tie back to the strength in your liquidity position—not only how much you have presently, but also how much liquidity you may need to support loan growth objectives.
Looking at liquidity trends
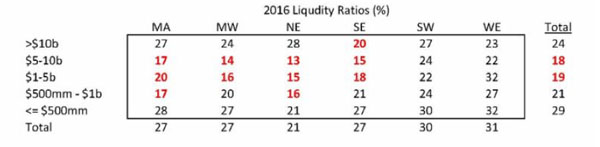
A quick analysis of data from SNL Financial indicates that liquidity is relatively tight for most mid-sized community banking institutions (i.e. assets between $500 million and $10 billion) when measured by the regulatory liquid asset ratio.
This assumes that we use 20% as the benchmark floor for unpledged cash and investments. The exceptions include those banks that operate in the Southwest and West.
Note that the regulatory liquidity ratio includes municipal and other non-agency bonds that have increased as a percentage of industry investment portfolios; are commonly held at unrealized losses in the current market; and possess limited collateral flexibility.
In this regard, we might conclude that even the Southwestern and Western region banking institutions are likely operating with limited flexibility to employ the investment portfolio to support lending activity and/or potential deposit attrition.
The more accurate conclusion may be this: With the exception of the largest institutions (> $10 billion), that are required to hold excess liquidity under Basel III, and the nation's smallest institutions (< $500 million), that traditionally behave more conservatively with funds management practices, liquidity is tight industrywide, across asset sizes and geographic regions.
[Editor's note: Click on graphs and tables to access larger versions in separate windows.]
We've also explored macro-level data from SNL Financial to help us develop expectations for future liquidity pressures in 2017 and beyond.
Bold red highlights loan growth rates one standard deviation above the industry trend line and, in the next set of tables, deposit growth rates one standard deviation below the industry trend line. Both signs indicate potential for liquidity stress.
Bold green highlights loan and deposit growth rates that are 1 standard deviation below/above industry trend, indicating potential for liquidity relief.
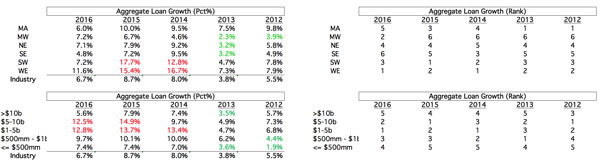
Some observations...
• Growth shift. When examining loan growth based on size and scale, banking institutions of all sizes have experienced strong growth over the past three years. However, the tide may have shifted in 2016.
• Two regions dominate trend. When examining loan growth geographically, it appears two regions (Southwest and West) have been the driving force behind the post-crisis resurgence in the national numbers.
• Post-crisis struggle. Three regions (Northeast, Southeast, and Midwest) struggled—comparably—for most of the post-crisis era. This is especially true in the Midwest. There, loan growth has lagged the national trends every year until recently in 2016.
• Most regions saw growth slow in 2016. In five of the six geographic regions, loan growth dropped significantly during 2016. More specifically:
• Three largest areas of slowing growth. This is most apparent in the Mid-Atlantic, Southeast, and Southwest regions. There annualized loan growth rates are down by 40%, 33%, and 59% respectively.
• West taps brakes too. In the Western region, loan growth for 2016 (vs. 2015) was down 25%.
• Happy days in Midwest. Interestingly, the sole exception was the Midwest region, which has experienced increased growth in each of the past three years and exceeded national growth for the first time since 2011.
• Growth slows, but still strong. Most importantly, despite the drop in 2016, loan growth remained strong in each of the six regions and across the variance asset size tiers.
However, loan-based liquidity pressures appear to be present and meaningful.
If we examine deposit data, it would appear that liquidity pressures are alleviating.
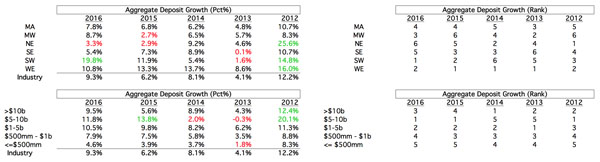
Some observations...
• All but smallest see growth. Deposit growth trends have been strong for most institutions, except the smallest (less than or equal to $500 million).
• Northeast faces turbulence. The same is true regionally, except in the Northeast where growth has been noticeably choppy, averaging 3.1% in the most recent two-year period (2015 and 2016).
• Where growth gathers momentum. Only two regions (Mid-Atlantic and Southwest) have experienced accelerating deposit growth in each of the past three years. However, this is true in the larger majority of institutions that have total assets at or below $5 billion. In this regard, it would appear that liquidity pressures are likely to exist more regionally than across asset-size segments.
The rate at which industry deposits have grown has outstripped that of loan growth rates in four of the past five years.
However, examining loan and deposit growth rates in isolation can be misleading. We need to calculate a volume surplus/deficit between loan growth and deposit growth to gain a stronger understanding of liquidity pressures.
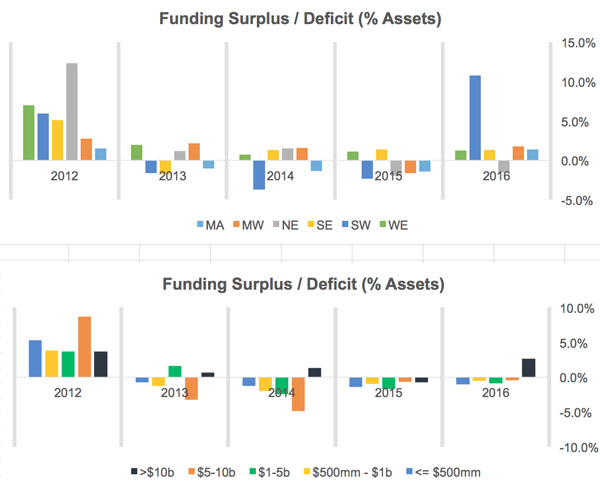
Some observations ...
• Gaps closing. Industrywide, liquidity pressure is diminishing as indicated by shrinking funding gaps across regions and asset sizes.
• Mixed funding trends. Regionally, the Southwest region shows the strongest liquidity trends since 2014. Interestingly, while they appear to be trending sideways, only the Southeast and West regions show consistent funding surpluses during the past three years. The other three regions (Midwest, Northeast, and Mid-Atlantic) have experienced choppy funding trends during this period.
• Largest players enjoy bulk of surplus. Across asset sizes, liquidity continues to be negatively impacted by loan growth volumes that exceed deposit growth volumes. As a result, ongoing funding shortfalls have persisted for the last several years. Only the largest banking institutions have experienced a funding surplus in the past three years.
• Deposits still drive funding. Underlying data indicates that strength in regional funding trends appears to be led by deposit growth, particularly at the largest banking institutions (>$10 billion).
While the data on loan versus deposit funding gaps supports the notion that community banking institutions are experiencing diminishing pressure, it is important to note that trends in deposit mix are shifting to be less favorable, leading us to a different conclusion.
Don’t miss the ongoing shift in funding mix
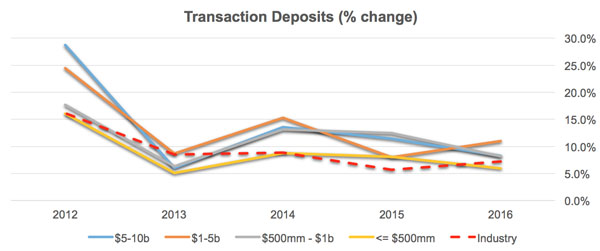
As indicated above, deposit growth rates are strengthening, but a deeper look indicates that growth is occurring in the industry’s more highly rate-sensitive categories, demonstrated below.
Growth in transaction accounts has actually been declining overall since 2012, with an increasing percentage of community banking institutions that are experiencing shrinkage in transaction account balances. (Top chart red line)
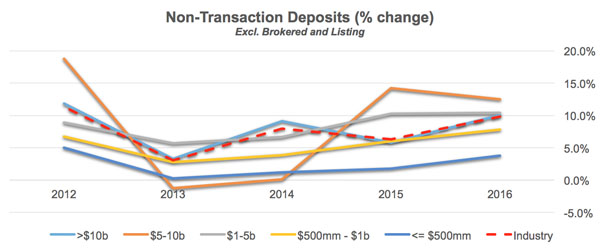
The reciprocal of this observation would indicate that non-transaction accounts and wholesale funding levels have therefore been rising, which is true. (Bottom chart red line)
Outlook: Liquidity and pricing implications
The outlook for liquidity in 2017 is intriguing.
Loan growth over the past year has diminished slightly, but remains strong. After the election in November, expectations for potential deregulation and favorable tax policies have triggered greater optimism in the business sector and added confidence to the household sector—though current events on Capitol Hill and elsewhere in Washington have presented some people with reason for caution.
Given some momentum for optimism, however, it is natural to therefore expect loan growth may get another boost and experience renewed upward trends in growth rate percentages. This is happening at the same time trend lines for growth in core transaction accounts have either stagnated or slowed, especially for smaller community banking institutions. In this regard, banks and credit unions can expect that liquidity pressures will rise as they seek to fund higher loan volume.
Volatility in liquidity levels are likely to increase also, due to changes in deposit funding mix. Non-transaction accounts, deposit listing balances, and brokered monies are traditionally less stable funding than are core checking and savings balances. Therefore, they present greater risk for migration or attrition.
When liquidity pressures are stretched, banking institutions are more susceptible to pricing pressures.
Banks and credit unions, of all sizes and in all regions, have already begun to engage in selective rate concessions. Soon more overt promotional activities will become commonplace. And from there, a gradual increase in standard "rack" rates will emerge.
This heightens the importance of developing a cost of funds management game plan now. The plan must include preemptive measures geared to slowing the speed at which your deposit costs rise, while also minimizing the downside risk to potential balance attrition.
This defensive strategic blueprint should not only include the development of defined pricing plans for various products, but also organizational communication systems with branch staff and public messaging at the board level.
These liquidity pressures are sure to lead to escalating interest expense levels. It will be the unprepared institutions that feel the greatest pinch in net interest margin.
Note: All data in this article has been sourced from SNL Financial.
About the author
Darnell Canada is a managing director for Darling Consulting Group, a solutions firm that specializes in the area of asset/liability management for financial institutions.
Canada works directly with C-suite executives helping them to understand the complexities of their balance sheet financial risks and providing guidance and unbiased advice on strategies that strengthen earnings performance. A former FDIC field examiner, he is a speaker and active educator, who enjoys participating in a wide range of educational programs for banks, including the ABA Stonier School of Banking and the Graduate School of Banking at Louisiana State University.
Canada holds a B.S. in finance from Bentley University and an M.S. in finance from the Carroll School of Management at Boston College.
Tagged under Bank Performance, Management, Risk Management, Credit Risk, Community Banking, Financial Trends, ALCO, ALCO Beat, Feature, Feature3,