


The Changing Landscape of Deposit Growth in US Banks
Technology, regulations, shifting demographics, and emerging Fintech competitors are changing the banking landscape
- |
- Written by Bob Graham, Executive Vice President Financial Services at Virtusa

Retail banks are experiencing a major systemic shift. Technology, regulations, shifting demographics, and emerging Fintech competitors are changing the banking landscape faster than we thought possible. Retail deposits have always been core to the growth and profitability of banks.
For the longest time, the competition over deposit growth was fought at the branch level. Today we are now witnessing a significant shift in approach and tactics with some clear winners and losers emerging.
On the competitive front, we have seen both encroachments as well as partnering with Fintechs, acquisitions, and the launching of mobile-only banks. On the regulatory front, the US Federal Reserve has raised interest rates five times in the last three years which was a major departure from the near zero interest rate environment the US had been operating in since the recovery began in 2008.
At the same time, advancing technology is driving change in consumer behavior and the nature of competition among banks. Consumer behavior is changing with ubiquitous mobile connectivity and is shifting how they interact with channels of interaction with banks. Fintechs bring new competition with the unbundling traditional business model of banks. The low cost of operations enabled by cloud combined with the marginal cost of acquiring new digital-only customers is causing many banks to rethink their growth strategy.
Lastly, the rise of bitcoin and other cryptocurrencies effectively challenging the traditional concepts of the stored value of money or deposits.
In response to these challenges, traditional banks have deployed several strategies, including acquisitions to bulk up deposits, branch rationalization and modernization, investments in their mobile and digital capabilities and a focus on mobile only customers.
In this paper, we take a detailed look at the market to identify patterns around which banks are winning the battle for deposits. We examined large national banks, super-regional banks, and regional banks to determine the correlation between overall performance and deposit base. We also examined the extent to which investments in digital and mobile technologies make banks more efficient and profitable.
US Retail Banking – An Overview
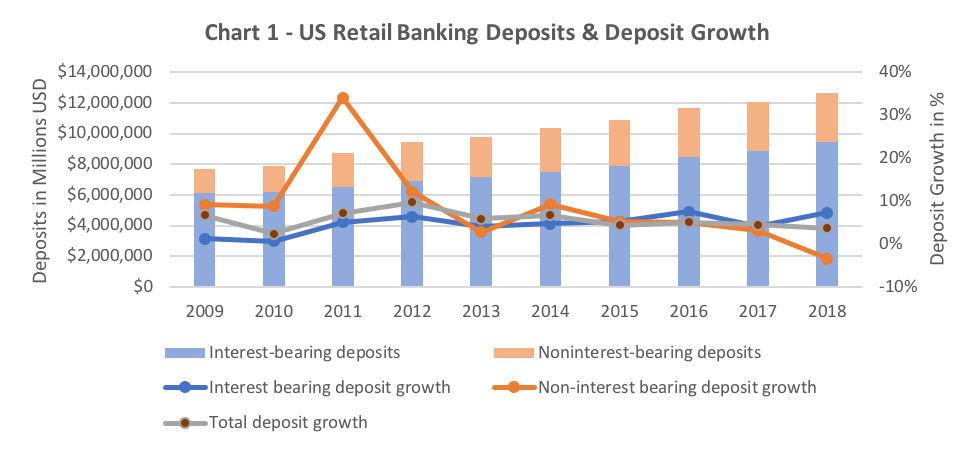
On the macroeconomic front, the US equity bull market has reached its 10th year, GDP has grown at a slow yet steady rate, and historically, low-interest rates have benefited both businesses and consumers. The retail banking sector has seen a regular year on year increase in retail banking deposits. Since 2009 both interest-bearing and non-interest-bearing have grown on average 4.6% and 8.6% respectively. [see chart 1]
Source: FDIC, 2018
However, the rate of total deposit growth has been slowing since 2014. The growth rate of 3.3% in 2018 was the worst since 2010. When we look more closely at the growth, we can see that interest-bearing-deposit growth has been relatively steady over the last ten years until 2018 when it grew by 7.3%. However, non-interest-bearing deposit growth has been in a downward trend and declined sharply and into negative territory in 2018 (-3.5%). A few systemic reasons are driving these trends. Rising interest rates in the last couple of years have led consumers and small businesses to explore the opportunity for better returns, including other fixed-income alternatives, equities, or even digital currencies like Bitcoin.
Source: FDIC, 2018
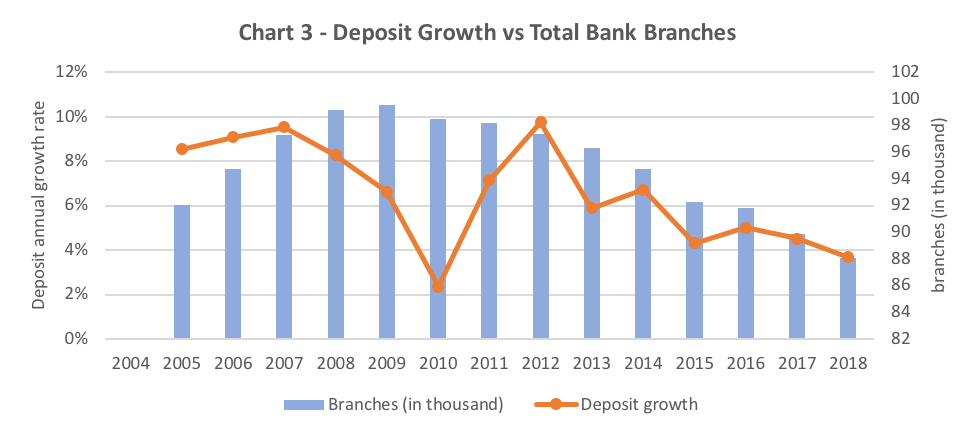
In the US, the number of branches has been in decline since 2009, down more than 11.53% from that peak or a reduction of over 12,000 branches. Retail banks have been rationalizing their branches through an effort to modernize and reconfigure them for higher productivity. Other branch closures can be attributed to merger activity which has been on the increase, as well as the shift to mobile channels. When we overlay the deposit growth rate against branches, we found a strong correlation in the decline in deposit growth rate coinciding with a decrease in branches. This trend line highlights that despite the shift to digital and mobile, there is still a major correlation in deposit growth to branches.
Source: FDIC, 2018
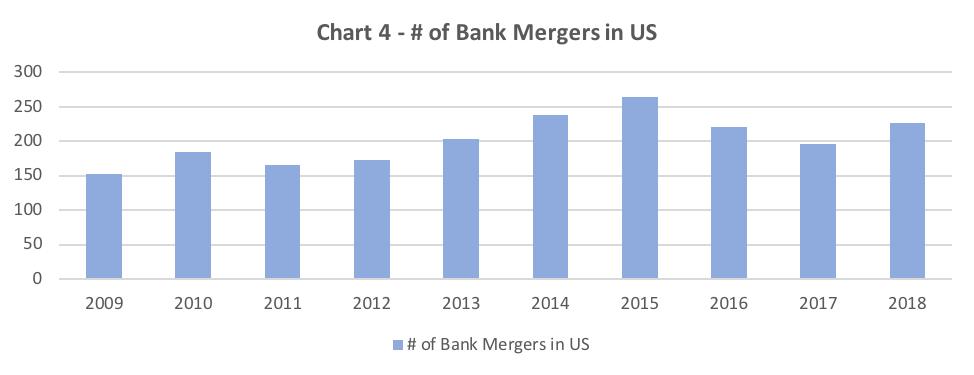
Merger activity in the banking space has significantly increased since 2014 with the last five years representing a 25% increase over the preceding five-year period. This speaks to accelerating competition for customers and deposits as well as the prolonged period of record low-interest rates as a source of funding. The recently announced merger of SunTrust and BB&T indicates the emergence of a new strategy where banks combine to achieve savings that can be reinvested in technology to compete better for customers.
Source: Statista Dossier on Online & Mobile Banking, 2018
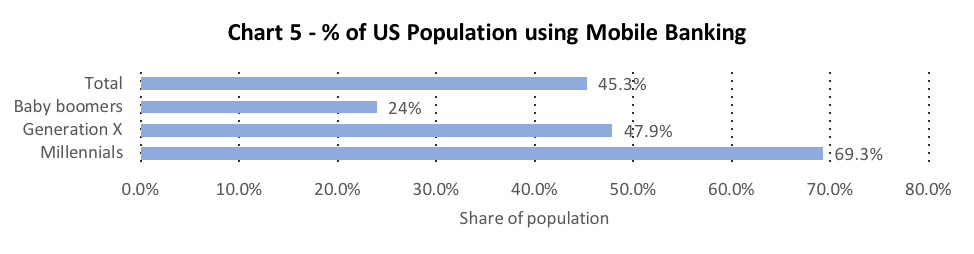
Another macro trend is the penetration of mobile banking. Banks are heavily investing in mobile capabilities, building out an array of features and capabilities to attract new customers. According to Statista, in 2018, 45% of all US households are engaging with their primary bank through mobile banking apps. There are several drivers for this trend with the high penetration of mobile devices being a leading factor. Another major reason for banks is that both the cost of acquisition and cost to serve these clients is substantially lower compared to a launching a new branch or executing an acquisition.
Furthermore, it is has become a necessity to cater to the latest generation of banking customers. As Chart 4 shows, 69.3% of Millennials use mobile banking, which is nearly 3X of the number of Baby Boomers. Investing in mobile is a requirement to attract and retain Millennials who are effectively the future of retail bank customer base. We can see this trend manifesting among several of the largest banks who have launched or announced the launch of mobile-only franchises such as Chase (FINN), Goldman Sachs (Marcus), and the announced national digital retail bank efforts of Citi and PNC.
These factors combined--slowing deposit growth, reduction in non-interest-bearing deposits, a declining branch network, and the rise of mobile banking only, put retail banks at a crossroads in driving growth. Various consumer surveys show that differentiation among bank product and service offerings are minimal and that consumers are most sensitive to price. With the relative maturity of mobile capabilities and the ubiquity of ATM, the importance and convenience of a branch have become less and less a factor while been seen more often now as a major drag on bank operating expense. Most banks now compete on the mobile front as the primary customer acquisition and servicing channel. However, this requires significant ongoing investments to compete in an ever-escalating feature war including mobile check deposit, peer to peer payments, mobile wallet, bill splitting, and so on.
The deep dive
In subsequent sections of this paper, we take a detailed look at the market to analyze patterns around which banks are winning in the battle for deposits. We examine patterns between the large national banks and other banks segments and determine if performance is based on deposit size. We will examine if investments made in digital and mobile are helping banks becoming more efficient. To determine this, we analyzed data from 2015- 2018 of the top 20 retail banks in the US as well as the US banking market as a whole.
To facilitate comparison, we created three major segments of banks based on their deposit size, excluding any deposits domiciled outside the US1:
- Group 1 – National Banks with over $500B in deposits which gave us JPMorgan Chase, Bank of America and Wells Fargo
- Group 2 – Super Regional Banks with greater than $100B in deposits: US Bank, Citigroup, TD Bank, Capital One, PNC, SunTrust Bank, BB&T
- Group 3 – Regional Banks with greater than $50B in deposits: Citizens Bank, KeyBank, Fifth Third, Regions Bank, M&T Bank, MUFG Union Bank, Ally Bank, Huntington Bank, BMO Harris, Santander, Zions and Comerica.
Deposit Growth
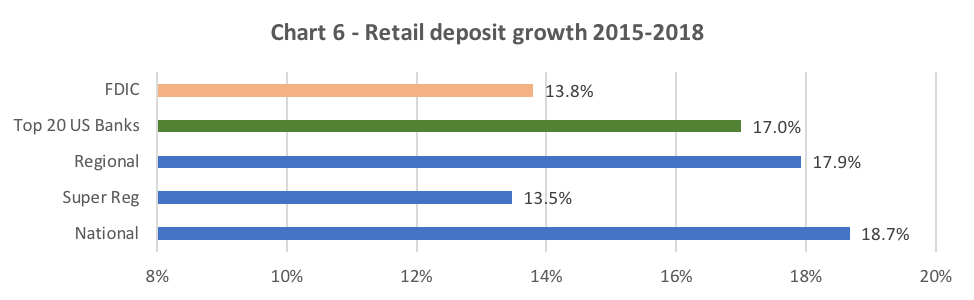
As highlighted earlier, retail deposits growth has been slowing since 2012. Chart 6 shows that the combined growth rate from 2015-2018 was 13.8%, according to the FDIC. Our study found that the top 20 US banks increased deposits at a rate of 17.10%, which is 1.23 time greater than the FDIC average for the period. The bigger banks are benefiting in taking a larger share of this growth. Evaluating the breakdown of the Top 20 banks further in our three groups showed that National banks (18.7%) and Regional banks (17.9%) outpaced the FDIC average by more than 1.25 times. This is a very significant delta compared to the FDIC average. The Super Regionals, however, at 13.5% slightly lagged the FDIC average growth rate, which suggests underlying fundamental challenges.
We looked next within our three groupings to evaluate performance and saw some distinct patterns emerge within. The growth at National Banks bested the FDIC average by 33%. On closer examination, we see some separation as JPMC (20.5% average growth), and Bank of America (19.3% average growth) grew substantially faster than the FDIC average. Wells Fargo however slightly lagged the FDIC average with a growth rate of (13.7%) which is likely related to the impact of several scandals as well as the Fed growth restriction order. Both JPMC and BoA have invested heavily in technology and marketing, and the results reflect the success of those approaches.
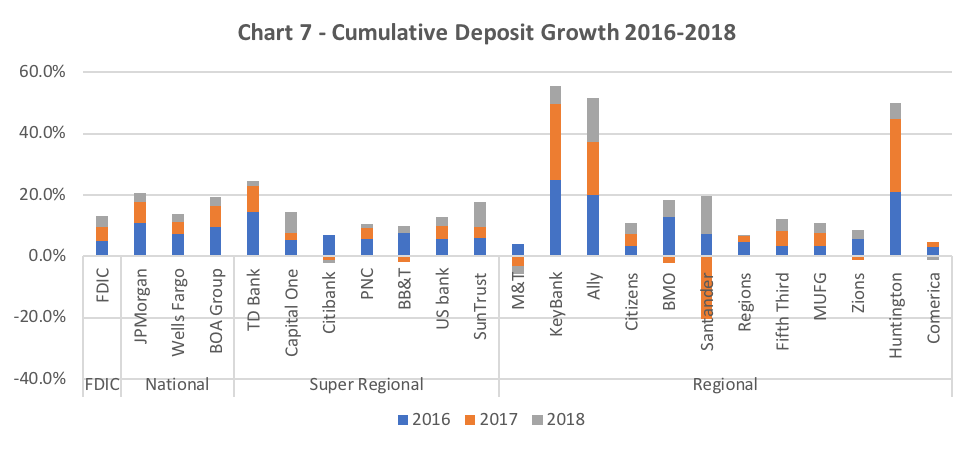
For Super-Regionals, we see more mixed results, and as a whole, the group underperformed the FDIC average. There are a few outperformers, including TD Bank, SunTrust, and Capital One, while Citibank, BB&T, and PNC underperformed the average. Super Regionals appear to be struggling to compete against both National banks and perhaps more nimble and price aggressive Regional and local banks. They are effectively caught in a squeeze between having to invest in competing with the National banks but not having the platform to engage customer acquisition beyond their current geographies.
There are significant variations in Regional Banks. Our examination shows outstanding performance by Key Bank and Huntington Bank; however, upon further analysis we find that both have grown through acquisitions. Ally Bank achieved the best organic growth overall of our top 20 list, most likely driven by its digital-only business model. Among the 8 banks below the FDIC average, Citizens, Fifth Third, and MUFG Union Bank were able to grow double-digits but still shy of the FDIC average. The remaining banks--M&T, Santander, Regions, Zions, and Comerica--have all shown significant underperformance with only single-digit growth overall, with each one having a negative growth year during our time period. Further, M&T and Santander saw negative growth overall during the period2. Overall, it seems clear these lower performing banks are struggling to compete in this increasingly digital era and unless powered by acquisition or a new digital strategy we see this group will continue to struggle against their bigger competitors.
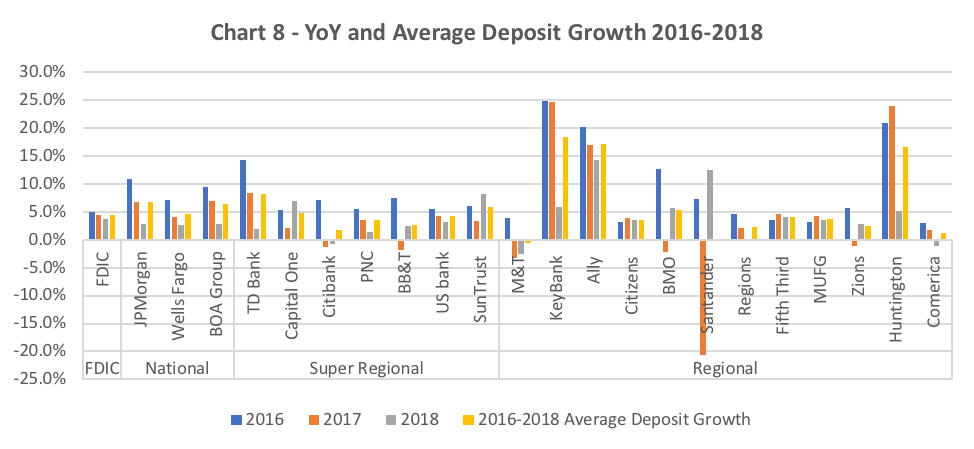
Evaluating year-on-year deposit growth from 2015-2018 shows a declining trend for banks across all segments. National banks have underperformed the FDIC average in 2018, which is concerning given the strong performance in the preceding two years and the amount of investment in the mobile and digital channel. JPMC launched FINN in 2018 and reported adding new customers and deposits on this digital platform but have been rather ambiguous in reporting results leading to speculation that the performance of this new channel has been disappointing. FINN may have helped their performance but not enough to beat the FDIC average. Similarly, looking at Bank of America and Wells performance in 2018 shows that the National banks were subject to slowing deposit inflow and deposit outflows more so than other groups. One explanation could be that smaller institutions who were perhaps paying more to attract deposits.
Super Regionals also seem to be struggling with deposit growth, with four out of seven coming in below the FDIC average for the period and none of our group beating the FDIC for all three years. Our top performers were TD Bank, SunTrust, and Capital One. TD Bank and Capital One have been two of the more aggressive banks in investing in mobile and major advertising campaigns. SunTrust has had an aggressive campaign to retain deposits with higher interest CDs.
The rest of our group has shown below average performance, particularly over the last two years, and Citi shows up as the laggard overall with two years of negative growth in deposits. Citi has made announcements about launching a national retail bank which could serve to improve its deposit outlook. BB&T also underperformed the FDIC standard by 41%, which is likely a contributor to its acquisition by SunTrust. US Bank has maintained the deposit growth close to FDIC because of its efforts in digitalization innovations, such as money transfer and digital payment solutions.
Among the Regional banks, the top performers --KeyBank, Ally Bank, and Huntington Bank--all grew over 60% in the period. However, both KeyBank (First Niagara) and Huntington (First Merit) were powered by acquisitions and though post acquisitions they have maintained above average deposit growth based on strength in retail banking, growth from commercial clients, as well as clients shifting to higher yield deposit products.
Ally Bank and their digital-only offering have continued what has been an impressive multiyear growth run and by far has the most impressive growth of any of our top 20 banks.
Non-Interest-Bearing Deposits
As mentioned in the opening, we have observed a decline in non-interest-bearing deposits with 2018 seeing a negative growth of -3.5% overall. We took a closer look amongst our three groups and found that Superregionals have suffered the most significant drop.
| Non-Interest Deposit Growth | |||
| Group | 2016 | 2017 | 2018 |
| National Bank | 4.4% | -1.1% | -4.6% |
| Super Regional | 10.4% | 2.6% | -10.9% |
| Regional | 7.7% | 1.7% | -0.5% |
Among the top 20, we see a pattern emerge where 8 of our top 10 largest banks saw a net reduction in non-interest-bearing deposits from 2015-2018. At the same time, all 10 of them achieved positive interest-bearing deposit growth, with six of this having achieved +13.3% growth in interest-bearing deposits suggesting that they kept much of the flow in-house. However, this shift would come at a cost to net interest margin.
We see an opposite pattern emerge among the regional banks where 11 out of 12 banks grew non-interest-bearing deposits in contrast with their bigger competitors. Further, one-quarter of our group had negative growth in an interest-bearing category, whereas their larger competitors were all positive. If we look further at interest-bearing growth, we see much lower percentages excluding Huntington and KeyBank’s acquisition-related growth with three banks having negative growth and three others below 8%. This suggests a flight of some deposits to other alternatives, outside these banks for higher interest opportunities which are likely is a direct result of decisions around how high interest to pay to retain and attract deposits.
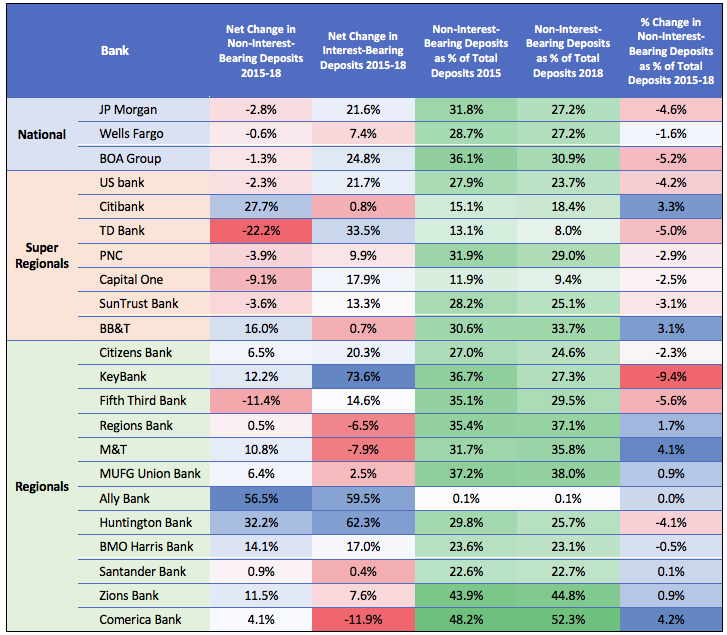
We further looked at the change in the percentage of noninterest-bearing deposits to overall deposits from 2015 to 2018.
Looking at the National and Super Regionals, there is a clear negative shift among 8 of the top 10 and with JPMC and Bank of America having two of the most significant changes, suggesting pressure on bank profitability in coming years. Of note is that two of our struggling growth banks (Citi and BB&T) were able to show a positive metric over that period, suggesting that they can attract new non-interest deposits while their peers are not. We can infer that perhaps based on the profit challenges, they decided to not compete as heavy on the interest rate side and therefore preserve interest rate spread. At the regional bank level, we can observe better performance at maintaining, or in the case of six institutions (Regions, M&T, MUFG, Santander, Zions, Comerica), improving their ratio, suggesting that while these banks are not growing deposits but can protect their funding base. Ally Bank is noteworthy in that they provide interest on their checking accounts, which is likely a key contributor to their deposit growth.
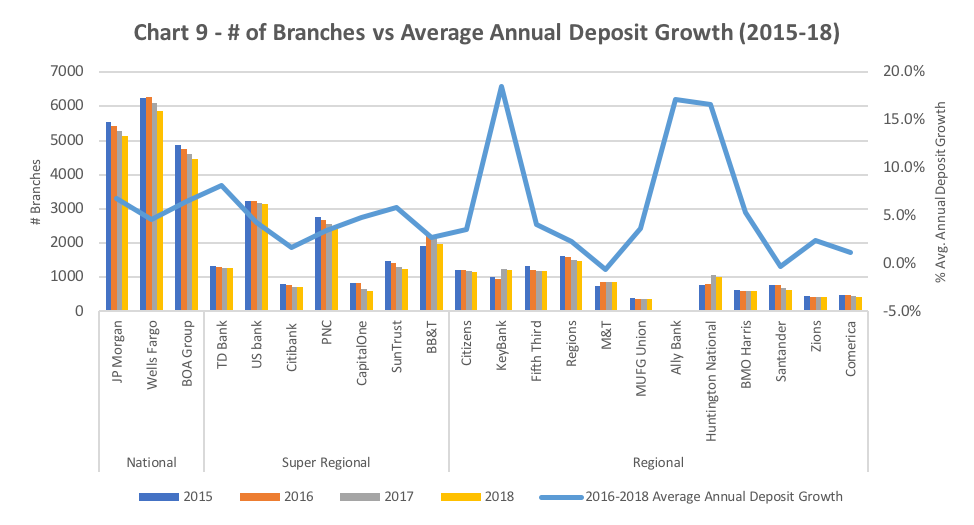
Retail banks have been rationalizing their branches for a more than a decade now and have been modernizing and reconfiguring them for higher productivity. Looking at branch numbers for banks individually, we can see that the majority of banks have been rationalizing branches while maintaining deposit growth. National and Super-Regional banks seem to be reducing their physical footprint faster while maintaining steady growth. Among the Regionals, there seems to be a significant variance in deposit growth and branch footprint pattern. Keybank and Huntington have grown the number of their branches via acquisition and could be looking to rationalize them over the next few years to fully realize benefits of scale. M&T, Santander, Citizens, Regions, Zions, and Comerica are growing slower while reducing branches. This suggests that they are having a tough time attracting deposits, and for them, physical branches still could be a key source of growth. Standing out considerably on this chart is Ally Bank, which has the best deposit growth of the top 20 and has done so without the benefit of a branch network.
Are banks investments in digital yielding more efficiency and productivity?
We also examined the impact of technology on increasing efficiency and deposits. We baselined current figures as well as the change from 2015 to 2018 to determine if those investments in technology were showing dividends.
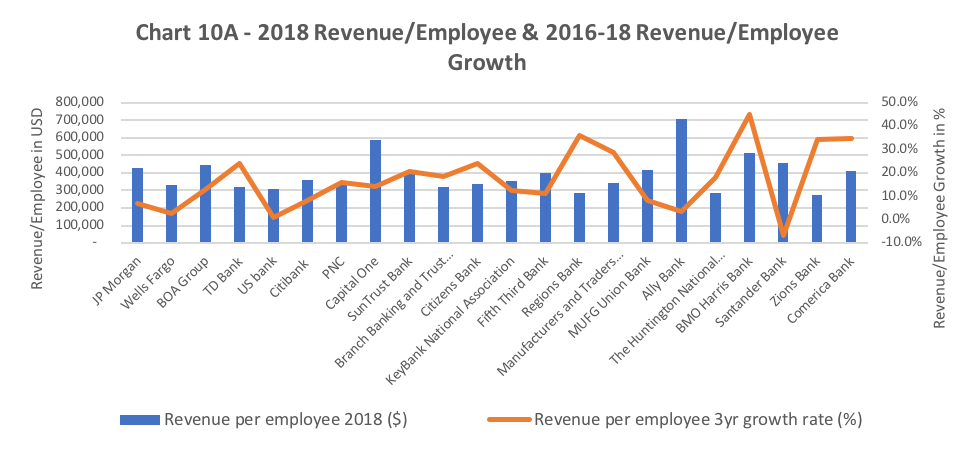
Looking at Chart 10A, we plotted 2018 Revenue per employee and overlayed the growth percentage in revenue per employee from 2016-2018. Looking at revenue per employee, National Banks had the highest productivity at $401,767. Super Regionals averaged 376,233, which is about 6.8% worse than National Banks. Regional banks came in just below the nationals at 399,180. However, we discovered that by subtracting Ally Bank, their performance was 8.2% worse than Nationals, which would have made this group the laggard. The takeaway here is that the National Banks, with their bigger investments in technology, are outpacing the revenue productivity of their competitors by between 7-10%.
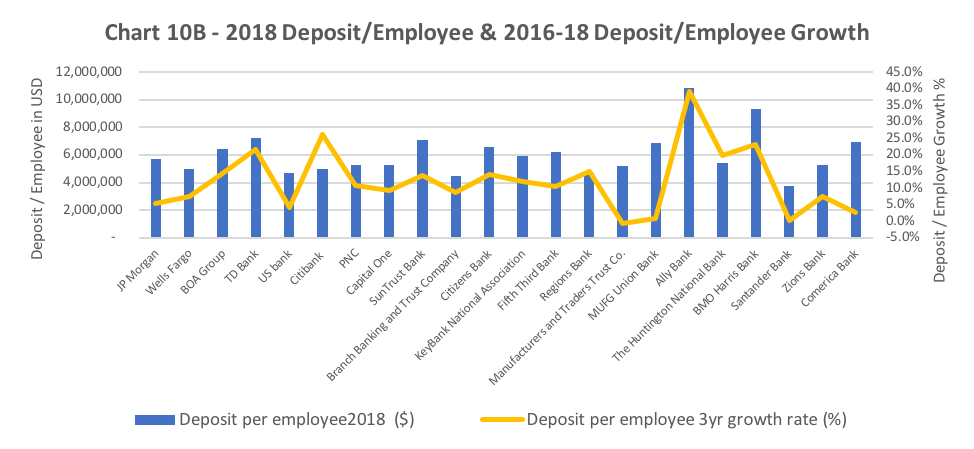
Chart 10B shows analysis on deposits per employee and growth between 2016-2018. We were expecting to find that the larger banks with the major investments in technology would show more efficiency and higher pace of reducing headcount. However, the data shows that Regional banks were the best performing group at an average of $6.43M, followed by Nationals at $5.71M and Super Regionals at $5.56M. Even with removing Ally Bank, we found regionals still outperformed both the other groups. In tracking the trend line, we, however, we can see that Superregional banks on average have been increasing deposit per employee by 13.6%. We can conclude that there is investment happening to drive up their performance in this metric, which is offsetting laggard deposit growth.
In terms of driving more efficiency, we can see top performers Ally Bank (39.2%), Citi (26.4%), and BMO Harris (23%) leading the pack compared to the overall average for the twenty banks being 12%. All our banks, except M&T Bank, had a positive improvement in employee deposit productivity. However, 12 banks improved less than 12% during that time, and the entire National Bank group underperformed the mark while MUFG and Santander were 1.0% or less. The National Bank performance was surprising as we know that that group has lead performance in adding deposits but has also at the same time been increasing employee headcount.
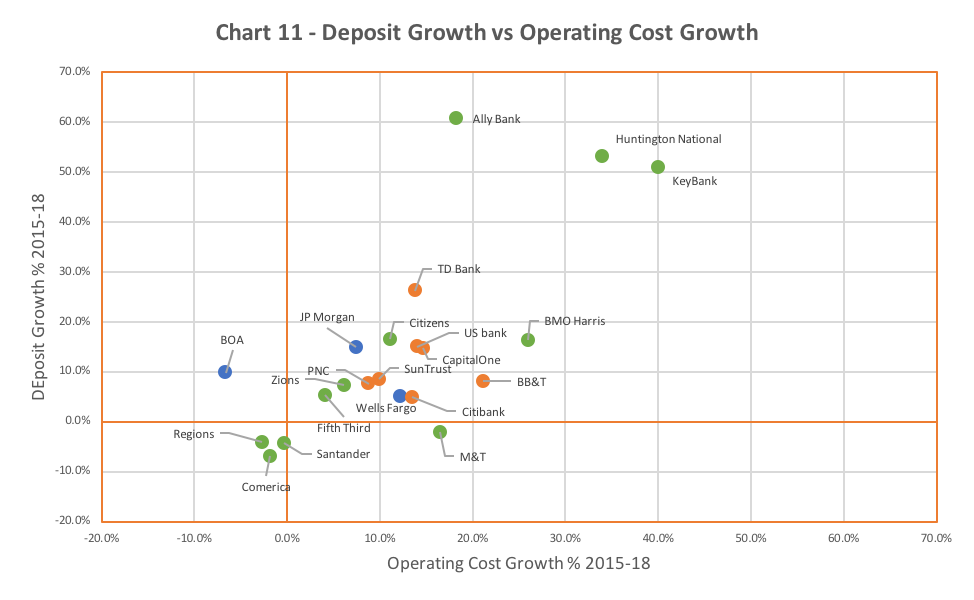
The analysis of retail deposit growth and operating cost growth shows a clear distinction between overperforming banks and underperforming banks. Some banks managed to grow their deposit without a corresponding increase in operating cost. Ally, the digital bank, has grown its deposit by 60%, and its operating costs only increased by 18%, suggesting that they can leverage their technology platform without adding additional significant headcount or cost. This result is better than Key Bank and Huntington, which saw a deposit growth of 51% and 53% driven by acquisitions. Their operating cost increased by 40% and 34% respectively. We would expect to see some rationalization of their operating costs over time to realize the synergies from acquisitions. Also, worth mentioning in this chart is the two National banks, JP Morgan and BOA group, the deposit increased by 15% and 10%, and JP Morgan’s operating cost only increased by 7% whereas BOA managed to cut their operating cost by a shade more than 6%.
Looking at the group performance and comparing the difference between deposit growth and operating costs found that National Banks achieved the best performance. We saw Super Regional as a group have costs grow greater than deposits. In taking this view, we can see that National banks are getting higher productivity for managing their operating costs and benefits of technology spend.
| Growth-Cost | |
| National | 5.6% |
| Super Regional | -1.5% |
| Regional | 3.9% |
How banks are doing on mobile banking front?
We examined the mobile app ratings for the top 20 banks and found an interesting correlation between app rating and technology spend, which we believe correlates to the digital readiness of a bank. The big three all had strong ratings of 4.8, while the Super Regionals averaged 4.7 except for SunTrust. The Regional Banks as a group have the lowest overall ratings for their mobile apps showing a combined rating of 3.3. In fact, of the Regionals only Ally (4.8) and Santander (4.7) has a rating close to their larger competitors.
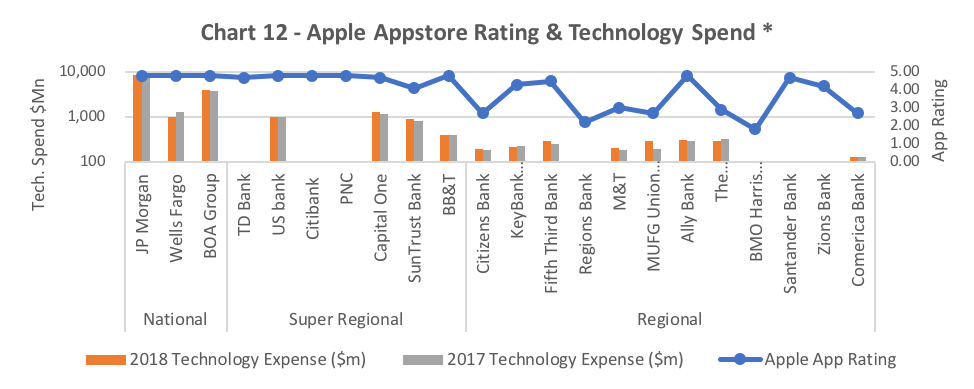
*Technology spend for some banks was not available or could not be estimated based on available data.
Interestingly among the banks for which technology spend data is available, amount of tech spend below shows a high correlation with app rating and that spending less than $200Mn leads to a mobile app with poor ratings as the chart above suggests.
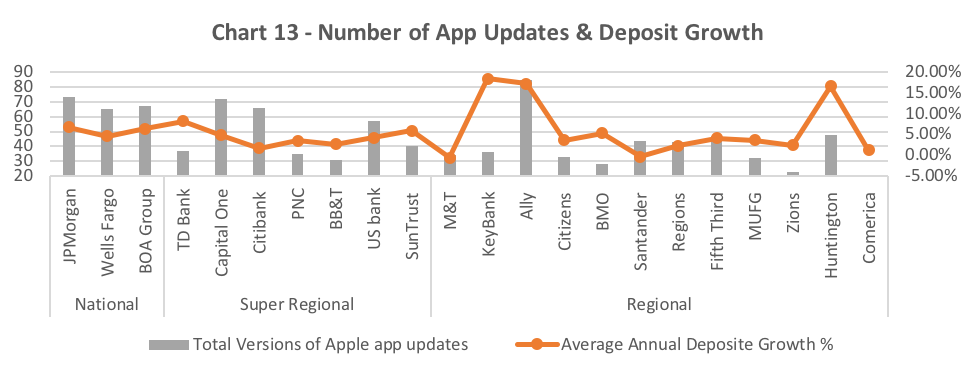
App store comments, feature, and functionality, as well as the pace of updates, are cited as key reasons for poor ratings. These are indicative of a lack of budget/talent needed to keep up with the pace of change. We found a loose correlation between the number of app updates and deposit growth, indicating banks that are frequently adding feature and functionality are tending to grow their deposits better than their peers.
Concluding thoughts
We started this paper to examine which segments and which banks were succeeding in today's retail banking environment which has been beset with a rising interest rate environment, a strong equity market, a declining branch network and the rise of mobile banking only users. We looked at multiple metrics, including overall deposit growth, the type of deposit growth, employee headcount, operating cost, mobile app rating, and examined across three segments of the market.
Our research suggests several key findings:
- Technology spending has become more and more of a factor in terms of attracting and retaining new customers. JPMorgan Chase earlier this year disclosed that it was spending 16% of its budget on technology or $9.5B. We think this is strongly correlated to deposit growth.
- The larger banks are growing deposits and customers at a faster pace.
- The larger banks have a better mobile app rating compared to their smaller competitors
- We see Super Regional banks in a struggle to compete with the nationals and growing less than competitor groups and below the FDIC average.
- We observed merger and acquisitions as a whole are on a significant upturn and we believe the SunTrust / BB&T merger could be start of merger and acquisition spree involving the super-regional and regional banks.
- Non-interest-bearing deposits, which represent a cheap source of funding for banks, has been in a decline for last several years, resulting in ratios of comparison to total deposits to decline. This will place pressure on net interest margin, which in turn can constrain the amount of spend available to compete on the digital and mobile front.
- National Banks are better able to leverage operating expense increase to drive deposit growth and also have higher revenue per employee than other groups.
What strategies that banks can use to respond?
In terms of strategic responses, there are several options that the banks can pursue:
- Continue aggressive transformation to digital-only channels and capabilities as the cost to acquire and cost service these customers are lower
- Use expanded digital only capabilities to expand target market beyond traditional branch footprint
- Embark on conversion to cloud and cloud-native capabilities to lower cost of technology and operational spend while increasing the ability to respond quicker
- Create partnerships with fintechs and other non-bank providers to leverage best in class capabilities that can attract customers and lower operating expense. No longer can banks build everything in-house or source from single traditional platform providers
- Drive acquisitions to increase customers and deposits as well to be able to consolidate and use savings to spend on technology Innovation in services and products
Depending on the context, and its specific competitive environment, one or a combination of strategies could help banks survive and thrive.
Tagged under Tokenization; AI; Financial Trends; Deposit Trends; Feature; Feature3; Fintech; Mobile; Online; Tech Management; Core Systems; Outsourcing/Cloud; Blockchain;