How exec pay’s evolving
Part 3 of a series: C-suite changes took some cues from surprising source
- |
- Written by Crowe Horwath Compensation Study
 Executive severance benefits have been cut significantly, says latest installment of Crowe Horwath compensation series. And increases in base pay for most in the C-suite have been modest.
The 2008 financial crisis and subsequent recession led to a significant restructuring of the financial services industry, as well as an extensive new regulatory framework that is still being adjusted and fine-tuned. But while federal support and new rules generated headlines, other less-visible changes were also occurring. These include some dramatic shifts in the way top banking executives are compensated.
The effects of these changes can be seen in the Crowe Horwath LLP Financial Institutions Compensation and Benefits Survey, an annual study of compensation trends and practices in financial institutions across the U.S. This article, the third in a series exploring the 2013 survey results, examines how executive pay, incentives, and perquisites have changed in recent years, comparing 2013 compensation practices to those reported at the low point of the recession in 2009.
While shifts in pay and incentives have occurred at many levels of the industry, some changes in the C-suite have been particularly dramatic.
Long-term versus short-term incentives
In early 2010, Kenneth Feinberg, the special master for executive compensation in the Troubled Asset Relief Program, raised eyebrows in the financial industry when he imposed a cap on CEO compensation in some of the largest financial institutions.
“Executives should receive a relatively modest cash-based salary—under $500,000—as their only guaranteed compensation,” Feinberg commented in an address at a conference on executive compensation sponsored by Vanderbilt’s Law and Business Program. “The rest of their salary will be in the form of ‘salarized’ stock.”
Although Feinberg’s jurisdiction was limited to seven major public companies that received TARP funds in 2009, his opinions naturally received widespread attention. Judging by the annual Compensation and Benefits Survey, it appears many boards of directors were listening when he advocated increasing the use of equity incentives in the executive suite to improve long-term performance.
In the 2009 survey, 24.2% of CEOs were participating in stock option incentive programs. Four years later, that number more than doubled to 57.9%. Comparable trends were seen in the use of nonqualified stock options and phantom stock plans (Exhibit 1).
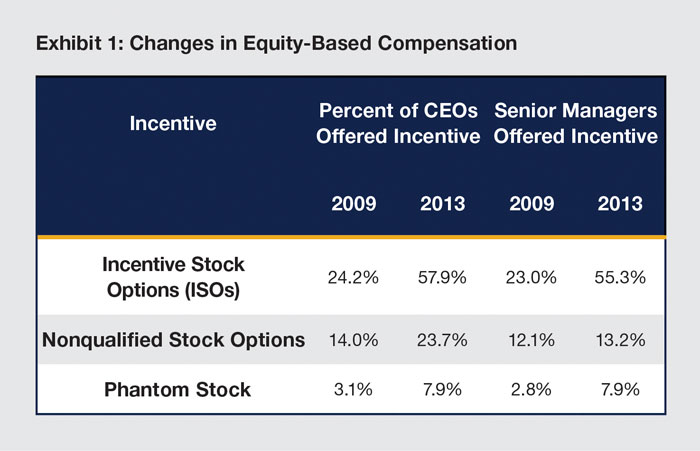
The use of incentive stock options also shot up dramatically elsewhere in the executive suite, with more than 55% of senior managers being offered such incentives in 2013, more than doubling the 2009 number. Such dramatic shifts in compensation practices over such a short time reflect the extraordinary changes that have affected the industry over the past four years.
Executive benefits and perks
Feinberg also made headlines with another rule he imposed on the banks under his jurisdiction: limiting executive perks to $25,000 per individual.
“No private jets, no country club dues, no golf club outings beyond that $25,000,” Feinberg said.
In this area, however, it appears that boards’ publicly stated interest in limiting executive perks has not produced comparable changes in actual practice—with one notable exception.
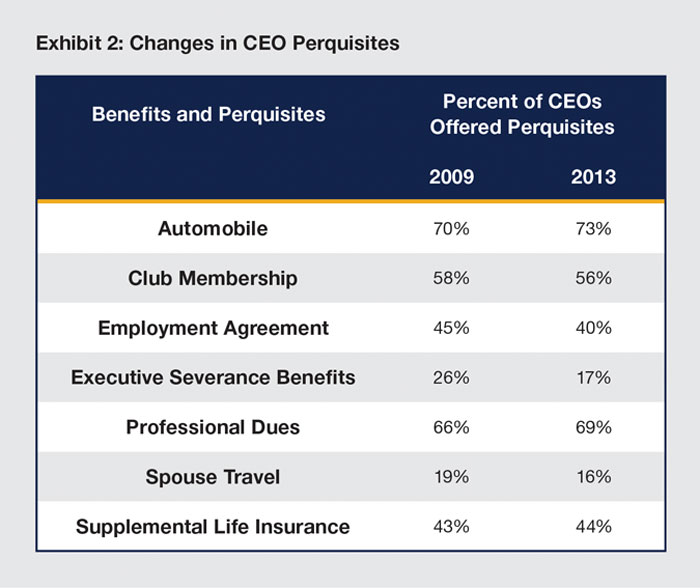
As Exhibit 2 indicates, company cars, club memberships, and even spouse travel benefits have not changed dramatically between 2009 and 2013. Executive severance benefits, however, have been cut significantly. In 2009, 26% of CEOs had such benefits; by 2013 that number was down to 17%.
(Although not illustrated in Exhibit 2, the trends in other top executive positions were quite similar—with few notable changes in perks.)
Cash incentives versus base pay
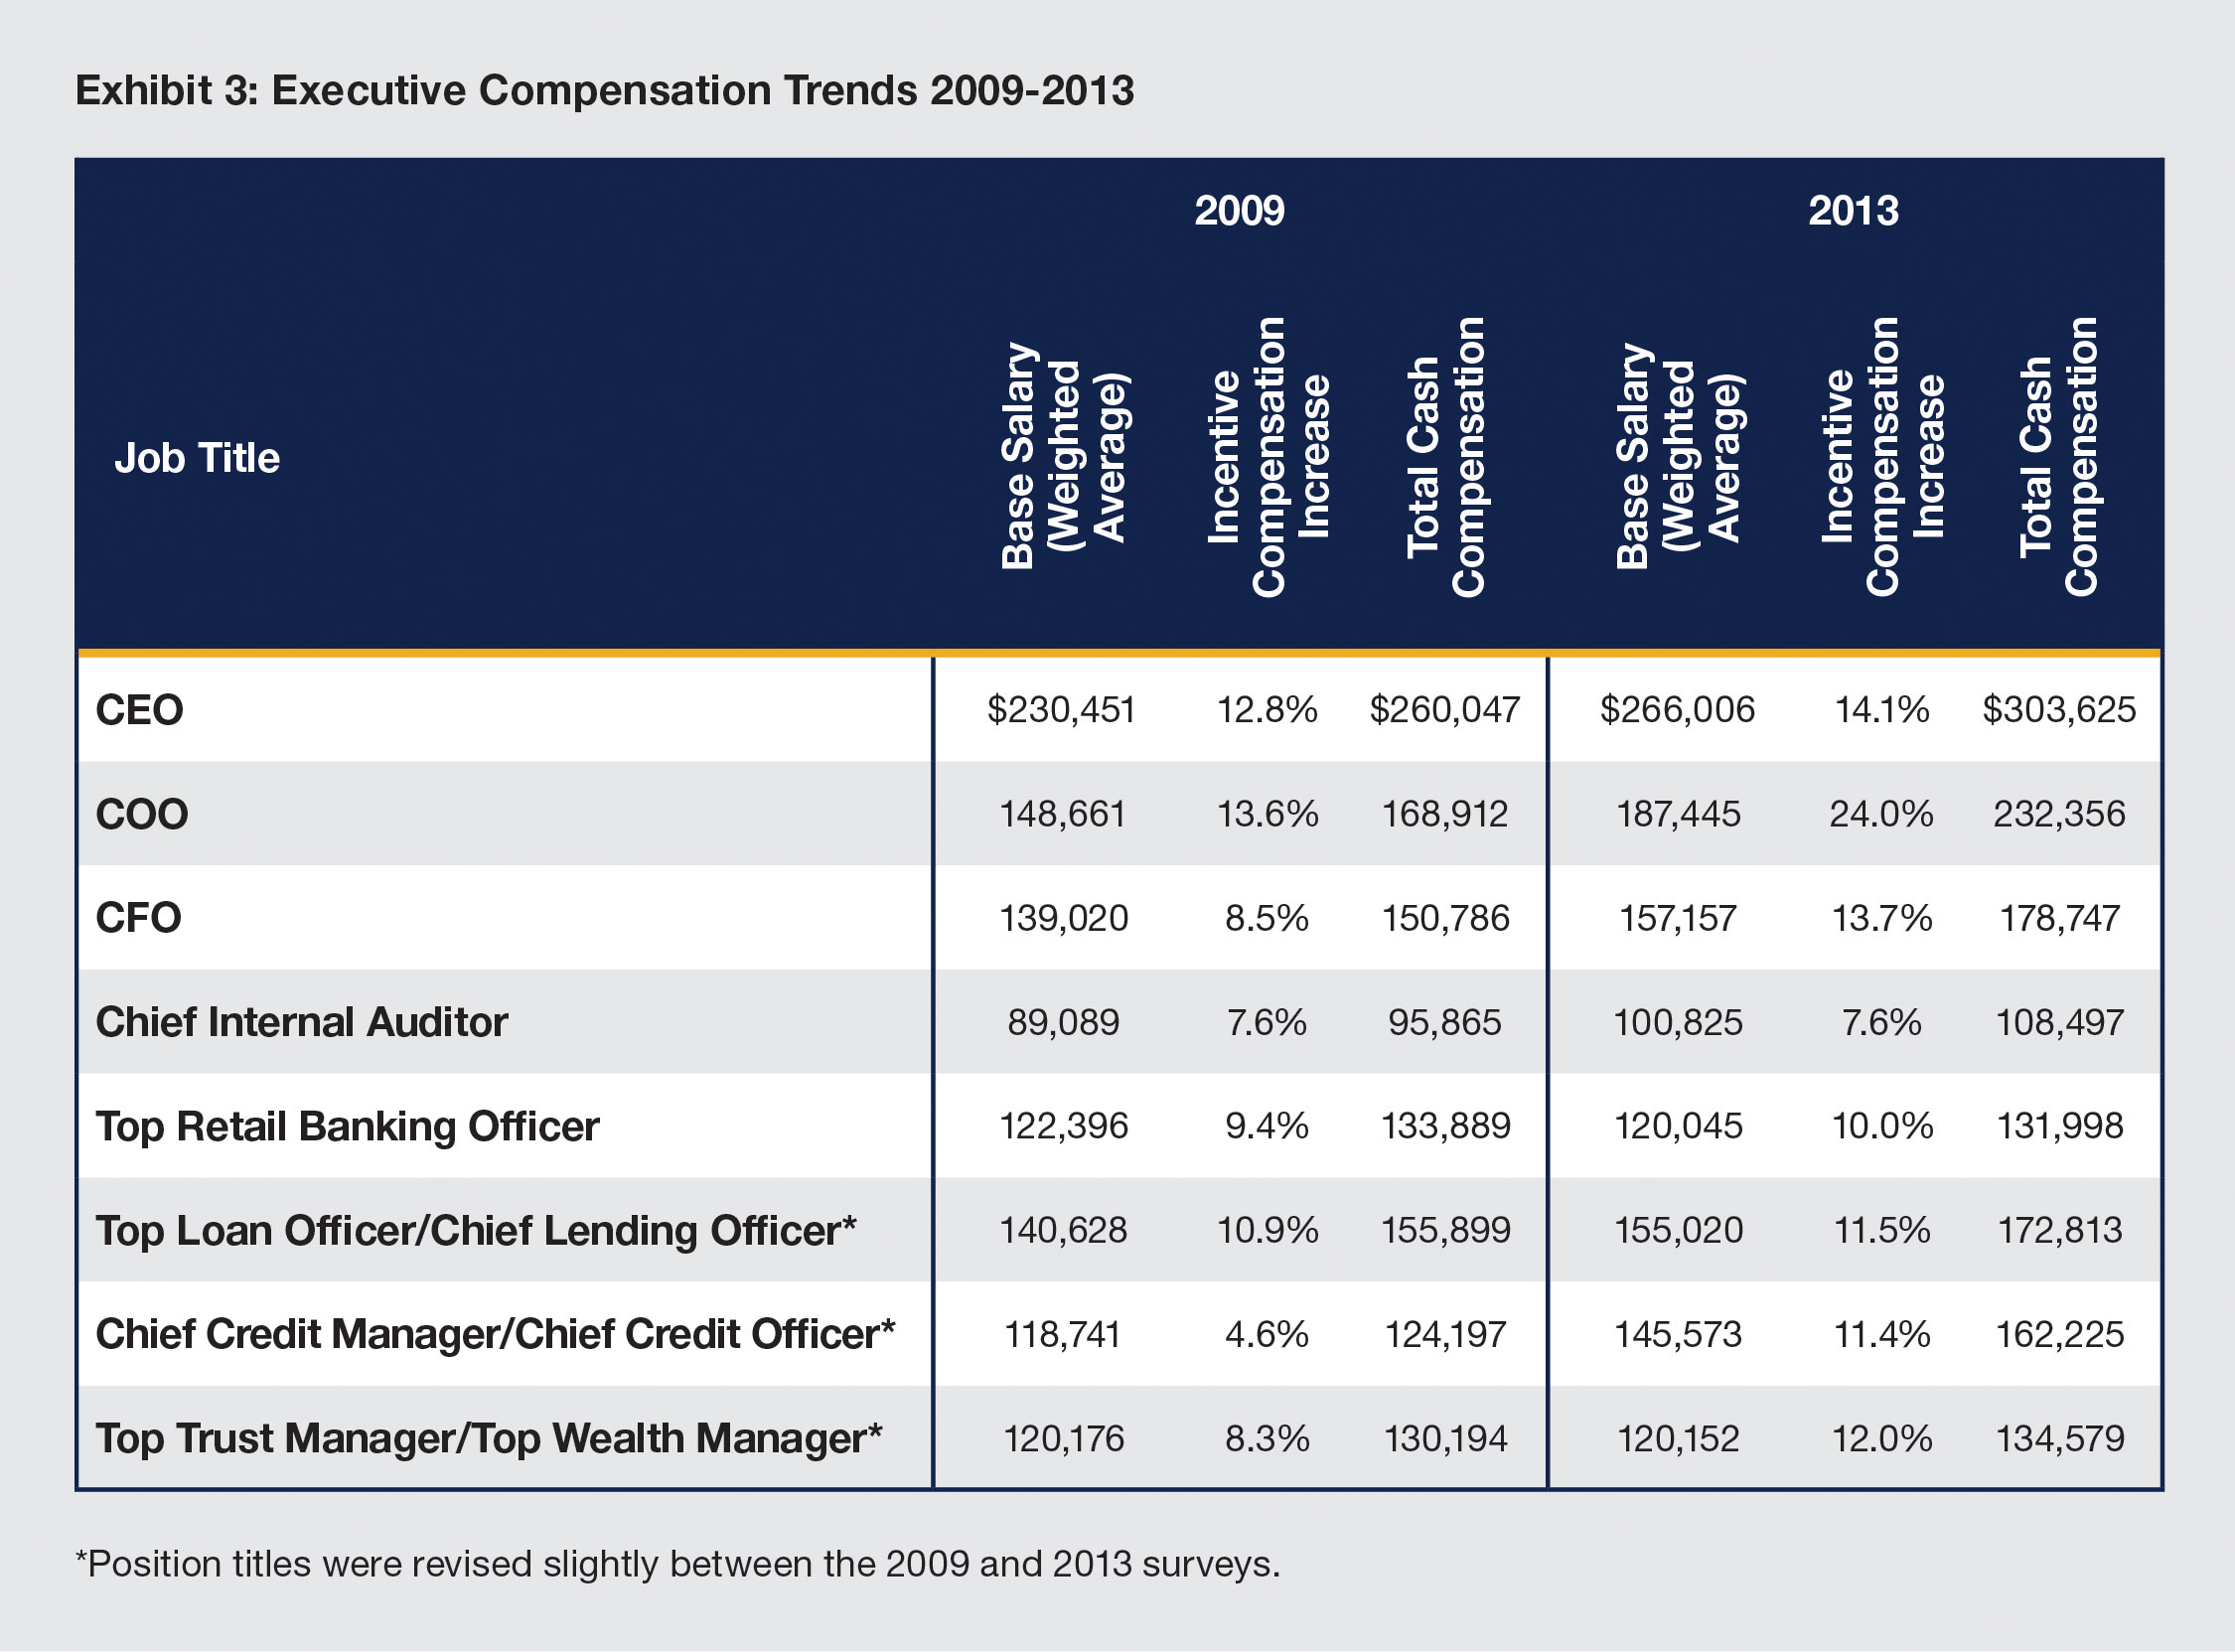
As shown in Exhibit 3, increases in base salaries have been relatively modest for most top executives in recent years. Except for chief operating officers (COO), whose salary increased by more than 6% per year between 2009 and 2013, salary increases for most executives averaged between 3% and 4% per year.
During the same period, however, there has been a significant shift in the composition of executives’ total cash compensation, which includes base salary, bonuses, commissions, and other cash incentives. Many, but not all, of these short-term incentives are based on performance—both by individual and by the group, division, or institution overall.
For example, in 2009, the weighted average base pay for all CEOs in the survey was $230,451. This base pay was then increased through various incentives by an amount equal to 12.8% of base pay ($29,596). This combined for an average total cash compensation of $260,047.
Over the next four years, the average base salary and average total cash compensation for CEOs increased at roughly the same pace. By 2013, CEOs on average were receiving cash incentives equal to 14.1% of their base pay—a slight shift in proportion but not particularly noteworthy.
At first glance this might seem relatively unremarkable, but it is in fact quite telling when one considers how much the financial performance of most institutions has improved during the past four years. One would expect to see this improvement reflected in higher CEO bonuses, but the change has been nominal at best.
That’s not the case for everyone in the C-suite, however, as Exhibit 3 demonstrates.
 For a larger version, click on the image.
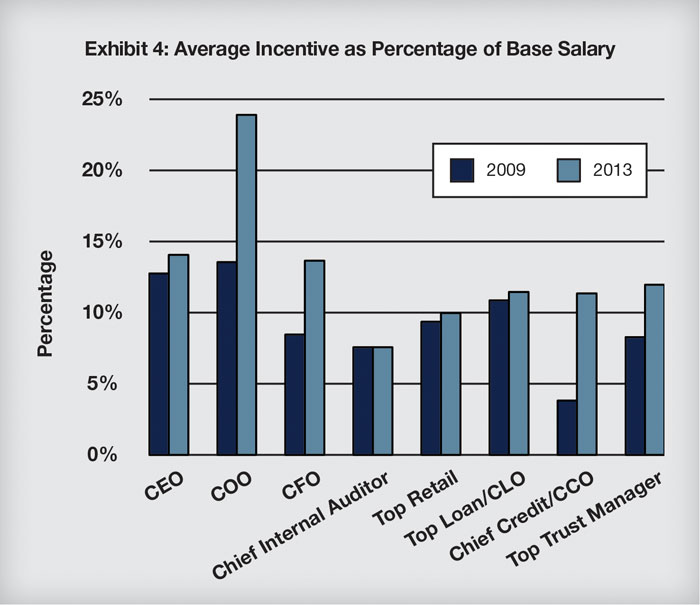
In 2009 the average bonus and short-term cash incentive for COOs was equal to 13.6% of base pay. By 2013 that proportion had almost doubled to 24%. For the CFO the ratio increased by more than half – from 8.5% to 13.7%. These shifts are even more apparent when the ratio of incentive pay to base pay is isolated, as in Exhibit 4.
Note that, while lending officers’ bonus performance has changed very little, the credit officer’s position has seen a sizable increase, undoubtedly reflecting the growing influence of this position as well as general success in cleaning up their institutions' loan portfolios.
Another interesting anomaly is the chief internal auditor, whose bonus proportion has stayed exactly the same over the past four years. This is somewhat surprising given the increased emphasis that most institutions have placed on regulatory compliance and risk management.
Changes in relative pay ratios
One other executive suite trend worth exploring is the ratio of pay between the CEO and his or her direct reports. Between 2009 and 2013, the gap between CEO and COO compensation narrowed significantly, with the COOs’ total compensation now averaging 76.5% of the CEOs’—up from 65% four years ago (Exhibit 5).
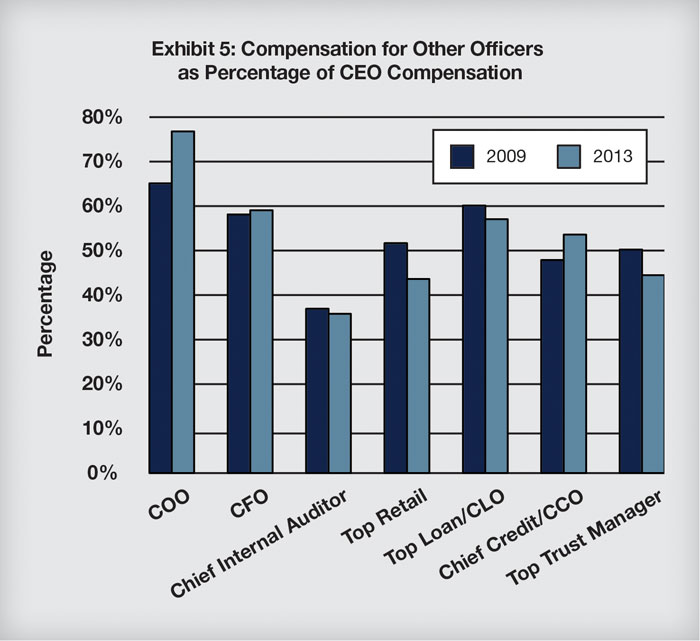
On the other hand, the gap between the CEO and the chief lending officer actually widened from 2009 to 2013. Similarly, the gap between the CEO and the top retail banking officer also widened, which—as with other trends in compensation—might reflect the changing demand for talent as customers’ banking habits shift emphasis away from traditional retail banking approaches.
These shifting compensation strategies in the executive suite are the result of boards of directors responding to pressures from regulators, shareholders, and the banking public. In the next article in this series, we will examine how boards themselves—particularly board compensation committees—have been affected by these trends.
Editor’s Note: Bankers will also want to check out ABA’s Compensation and Benefits Survey. Read a summary from Banking Exchange’s “Bank Notes” section here. Contact Mike Mazur, senior manager, ABA Benchmarking Survey Research Group.
Tagged under Feature, Management, CSuite, Human Resources,