Latest look inside megaplayers
SNL Report: Systemically risky banks bigger but less complex in latest filings
- |
- Written by SNL Financial
 SNL Financial is the premier provider of breaking news, financial data, and expert analysis on business sectors critical to the global economy. This article originally appeared on the subscriber side of SNL Financial's website.
By Zach Fox and Zuhaib Gull, SNL Financial staff writers
Banks subject to systemic risk reporting generally showed less complexity and fewer cross-border complications, offset by greater size and more substitutability relative to the previous year. And in another category, interconnectedness, the largest banks reported significant decreases, but opaque derivative exposure played a significant role, complicating the conclusions.
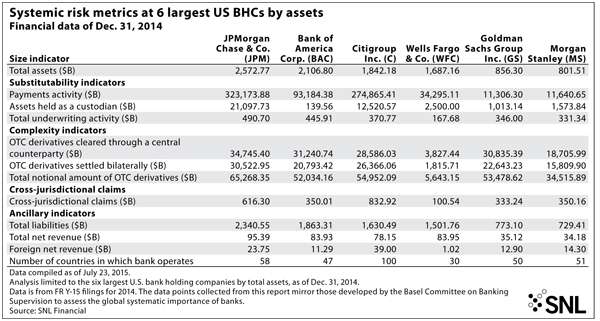
Among the largest six banks—all with total exposures of $1 trillion or more—Citigroup Inc. and Morgan Stanley posted year-over-year declines for eight of the 12 indicators used to determine systemic risk scores as calculated by the Treasury's Office of Financial Research. However, some of the most dramatic improvements for the banks were due to lower potential future exposure in derivatives, a model-derived figure.
Among the other four largest banks, JPMorgan Chase & Co. posted declines in seven of the 12 indicators, and the remaining three—Wells Fargo & Co., Bank of America Corp., and Goldman Sachs Group Inc.—posted more increases than decreases.
Systemic risk scores factor the 12 indicators across five categories, with each category weighted equally: size, interconnectedness, substitutability, complexity and cross-jurisdictional activity.
The data is collected by the Federal Reserve on FR Y-15 forms, reported by companies at various times in recent weeks. The most recent filings, which show data as of Dec. 31, 2014, represent the second year of publication and the first opportunity for year-over-year comparisons.
Getting into specifics
JPMorgan showed an increase in size but a decline in complexity, a familiar theme in the filings. On total exposure, the only indicator for the size category, 26 of the 33 bank holding companies subject to the filings reported year-over-year increases.
Banks also reported increases in substitutability indicators and were most likely to report decreases in complexity, cross-jurisdictional activity or interconnectedness. Goldman Sachs was an outlier, reporting a sizable 2.2% year-over-year decline in total exposures while showing increases in all three indicators for complexity.
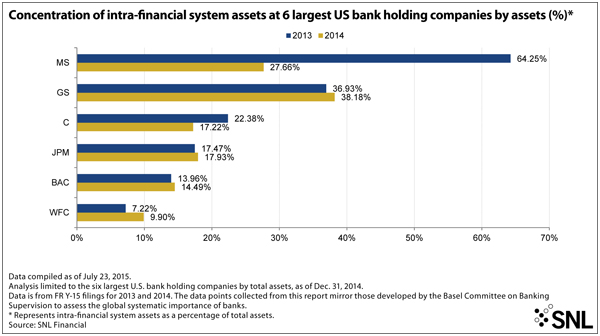
Among the six largest banks, Citigroup and Morgan Stanley both reported dramatic declines in intra-financial system assets, an indicator for interconnectedness. The change was driven by lower potential future exposure from certain derivatives.
Citigroup reported potential future exposure from derivatives with a net positive value that dropped by $97.4 billion, and Morgan Stanley reported a year-over-year decline of $32.4 billion. Meanwhile, the net positive fair value of those same derivatives increased by $8.2 billion for Citigroup and by $2.3 billion for Morgan Stanley.
"This is where it is too much of a black box," said Simon Johnson, a professor at Massachusetts Institute of Technology and member of the Systemic Risk Council. "Why those two numbers diverge is a good question."
Morgan Stanley and Citigroup both declined to comment.
 Click to Enlarge Image
While it is possible a different mix of derivatives could have higher current value and reduce future exposure, the more significant contributor could be a change in the model's expectations, said Ben Larah, a senior manager for Sapient Global Markets with derivatives pricing and risk modeling experience.
"If people's outlook on the economy is different a year ago from what it is today, then that's going to be tied up into all sorts of market variables, such as options volatility. … Then you might get a different expectation for potential future exposure for your portfolio," Larah said.
While the banks reported lower intra-financial system assets, another indicator used to evaluate interconnectedness—outstanding securities—increased.
 Click to Enlarge Image
In aggregate, the 33 banks reported a year-over-year decrease in intra-financial system assets of $71.0 billion. Model-derived potential future exposure accounted for $63.9 billion of that decline. Meanwhile, total securities outstanding for those 33 banks increased by $180.2 billion.
The Federal Reserve did not respond to a request for comment.
Wells bucks a trend
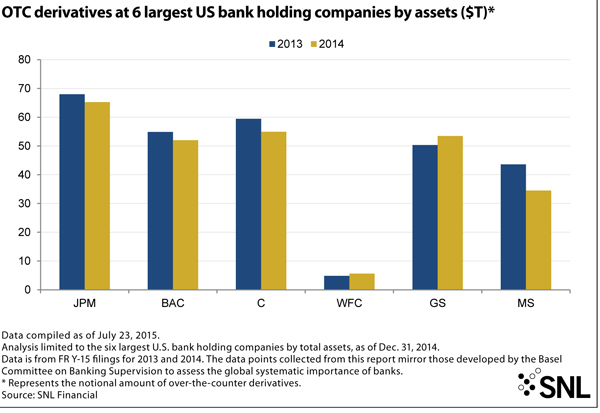
Contrary to Morgan Stanley and Citigroup, Wells Fargo grew across the board, reporting 12% year-over-year growth in total exposures and increases in 11 of the 12 indicators. Even with the increases, the bank had much lower figures than its big-bank peers for the four categories other than size, particularly the complexity category. Wells Fargo's derivative figures are roughly one-tenth the size of holdings at JPMorgan, Bank of America, Citigroup and Goldman Sachs.
The only indicator with a year-over-year decrease for Wells Fargo was its Level 3 assets. Many banks appeared keen on reducing Level 3 asset holdings, with the indicator declining or stuck at zero for 24 of the 33 banks that report the FR Y-15 filings. Banks have built up their holdings of "high quality liquid assets," which excludes Level 3 assets, to get in compliance with the liquidity coverage ratio.
 Click to Enlarge Image
In aggregate, the figures suggest systemically risky banks have increased in size while decreasing their complexity and cross-jurisdictional activity. Total exposures increased by $567.2 billion while all three indicators for complexity were down, headlined by a $15.36 trillion year-over-year decrease in total notional amount of over-the-counter derivatives. Both indicators for cross-jurisdictional activity were also down, with foreign claims on an ultimate-risk basis decreasing by $97.1 billion and total cross-jurisdictional liabilities falling by $71.8 billion.
All three substitutability indicators increased among the banks involved; some regional banks or specialty lenders do not report any data for certain items, such as assets under custody. In aggregate, among banks subject to systemic risk reports, payments activity increased by $83.53 trillion year over year, assets held under custody increased by $4.31 trillion and total underwriting activity increased by $225.9 billion.
Variable findings on “interconnectedness”
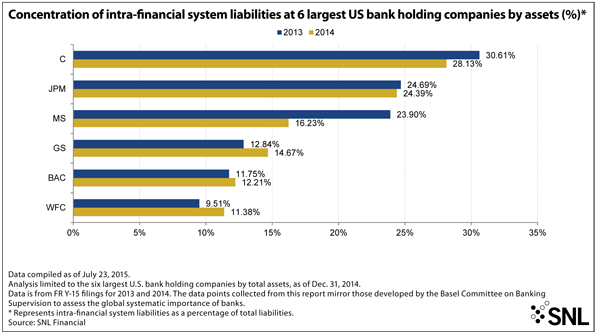
Interconnectedness indicators were mixed, with the aforementioned declines in potential future exposure of derivatives pushing inter-financial assets and liabilities down. Meanwhile, banks reported increased holdings of outstanding securities.
MIT's Johnson said it is difficult to tell whether the movement in any single indicator moved the needle from a systemic risk perspective but that the general movement across categories can prove insightful.
"I don't think we have enough experience and enough insight into these firms to really parse out the numbers too precisely," Johnson said. "I think the broad contours are very helpful."
 Click to Enlarge Image
This article originally appeared on SNL Financial’s website under the title "Systemically risky banks bigger but less complex in latest filings”