SNL Report: TDRs tread water, breaking trend
SNL Report: Slight uptick on troubled debt restructurings
- |
- Written by SNL Financial

By David Hayes, SNL Financial staff writer
Following two consecutive quarters when regulatory guidance pushed troubled debt restructured loans in opposite directions, the fourth quarter of 2012 proved to be less eventful. Aggregate troubled debt restructured loans, or TDRs, increased to $187.90 billion at year-end 2012, up from $187.08 billion a quarter earlier for U.S. banks and thrifts.
This minute increase in TDRs came a quarter after industry TDR totals were goosed by the Comptroller's updated guidance for loans discharged in a Chapter 7 bankruptcy. According to the OCC, these loans must be written down to their underlying collateral's fair value and classified as a nonaccrual TDR because the borrower has been "removed from the responsibility" of making payments as required by the original loan agreement. Aggregate TDRs then jumped by $14.49 billion across the bank and thrift industry in the quarter.
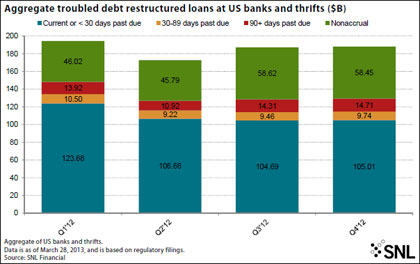
For a larger version of this bar chart, please click on the image or click here.
Large banks' TDR quarter
Collectively, the 10 largest banks and thrifts by loans and leases accounted for $115.19 billion of the industry's TDR tally.
Among the nation's largest banks and thrifts ranked by loans, Bank of America NA posted the highest percentage of TDRs to total loans at 3.98%. The company saw its TDRs jump to $30.10 billion in the fourth quarter of 2012, up from $27.81 billion a quarter earlier. One-to-four-family mortgage TDRs accounted for the lion's share of BofA's TDRs, coming in at $27.43 billion at yearend 2012.
In the second quarter of 2012, JPMorgan Chase Bank NA practically singlehandedly accounted for an almost 10% decline in industry TDRs after the company spoke to its regulator and decided to no longer include pooled loans in its purchased credit impaired portfolio when calculating TDRs. The bank's TDR totals then fell by $18.92 billion in the second quarter, affecting industry totals.
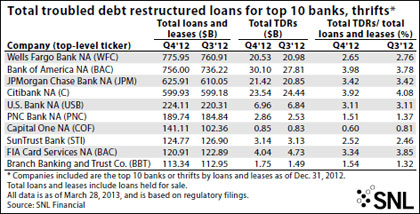
For a larger version of this table, please click on the image or click here.
Other banks' TDR experiences
Dallas-based Park Cities Bank's $93.5 million in TDRs equaled 32.50% of its total loans and leases at Dec. 31, 2012, the highest proportion of any U.S. bank or thrift with more than $250 million in assets. Park Cities continued slimming down in the fourth quarter, posting its 11th straight quarter when total assets declined. The company posted a net loss of $7.7 million in 2012, compared to net losses of $1.8 million and $42.9 million in 2011 and 2010, respectively.
Arlington, Va.-based E*TRADE Savings Bank climbed up the rankings as its TDRs and total loans moved in opposite directions. The company's total loans and leases fell to $294.3 million in the fourth quarter from $632.3 million a quarter earlier, while its TDRs rose to $87.1 million from $85.6 million over the same time period. The savings bank's parent, E*TRADE Financial Corp., stated that it expects loan runoff to continue for the foreseeable future in its 2012 Form 10-K.
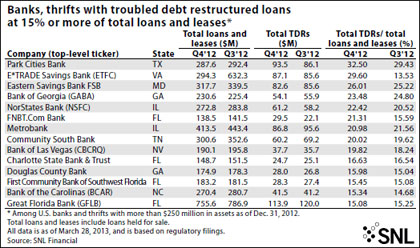
For a larger version of this table, please click on the image or click here.
And from the credit union camp...
The country's largest credit union--Vienna, Va.-based Navy Federal Credit Union--posted $818.4 million in TDRs at the end of 2012, equal to 2.42% of its loan portfolio. However, the vast majority of the credit union's TDRs, $776.8 million, are currently accruing interest, compared to $41.6 million in nonaccrual status.
Together, the 10 largest credit unions by loans and leases hold $2.39 billion of the credit union industry's $10.54 billion in TDRs.
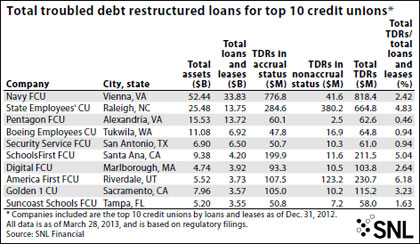
For a larger version of this table, please click on the image or click here.
[This article was posted on April 12, 2013, on the website of Banking Exchange, www.bankingexchange.com, and is copyright 2013 by the American Bankers Association.]
Tagged under Management, Financial Trends,